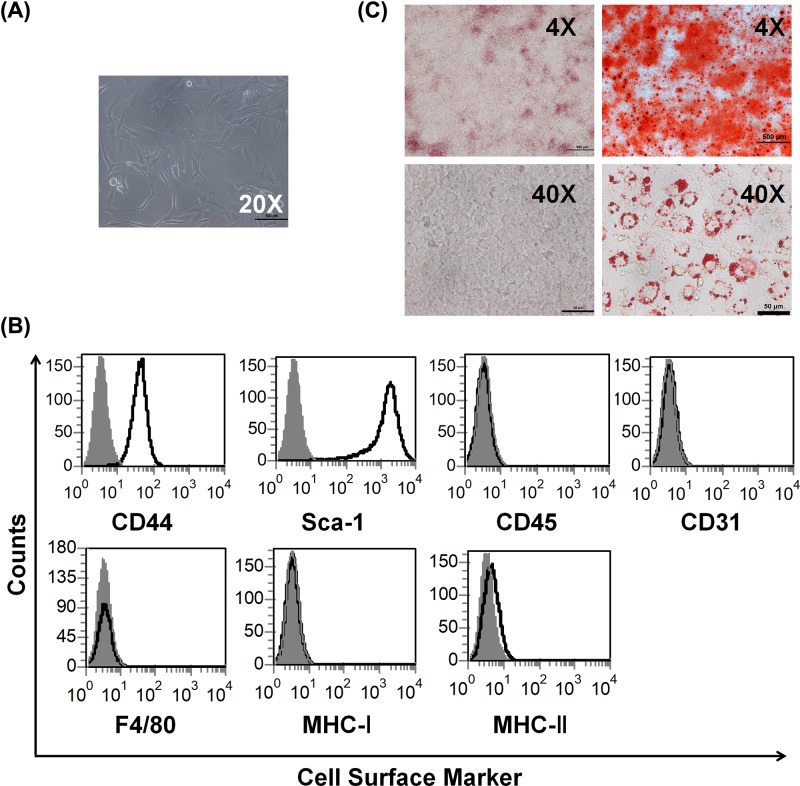
Figure 1. Characterization of murine MSCs.
(A) Morphology of murine MSCs (20× magnification). (B) MSCs were stained with specific surface markers or control antibodies and subjected to flow cytometry analysis. Cell surface markers, red; isotype controls, black. (C) MSCs were cultured with induction medium for indicated time to differentiation. Differentiation into osteoblasts and adipocytes were determined by Alizarin Red staining and Oil Red O staining separately (4×, 40× magnification, respectively).

