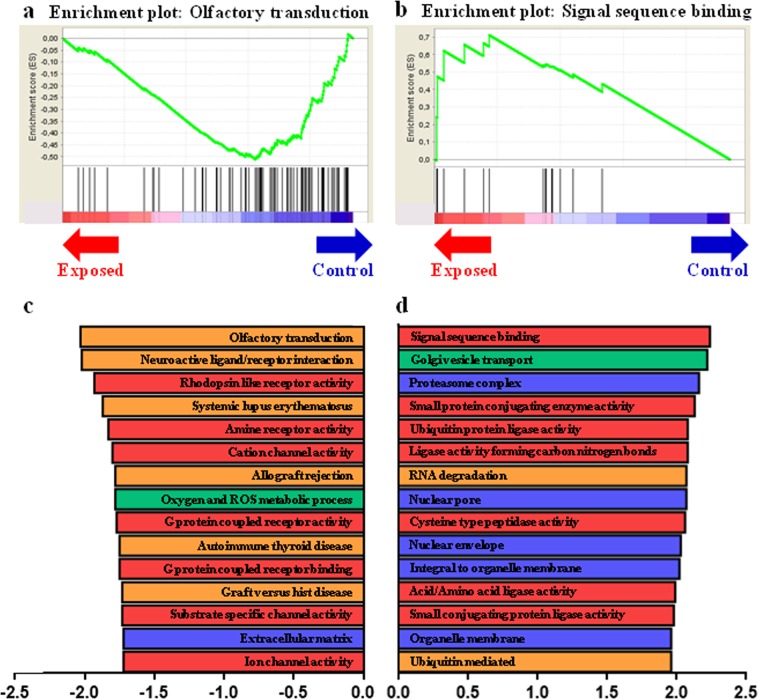
Figure 2.
Gene Sets Enrichment Analysis in F2 of control and exposed placental labyrinthine area at 28dpc. GSEA-enrichment plot of the most negatively enriched gene set: Olfactory transduction. (b) GSEA-enrichment plot of the most positively enriched gene set: Signal sequence binding. (c) Bar plot depicting the normalized enrichment score of the top 15 most negatively enriched gene sets, constructed using several categories of 2 databases: C2CP:KEGG (Orange), C5:BP (Green), C5:CC (Blue) and C5:MF (Red). (d) Bar plot depicting the normalized enrichment score of the top 15 most positively enriched gene sets, which contains several databases C2CP:KEGG (Orange), C5:BP (Green), C5:CC (Blue) and C5:MF (Red).

