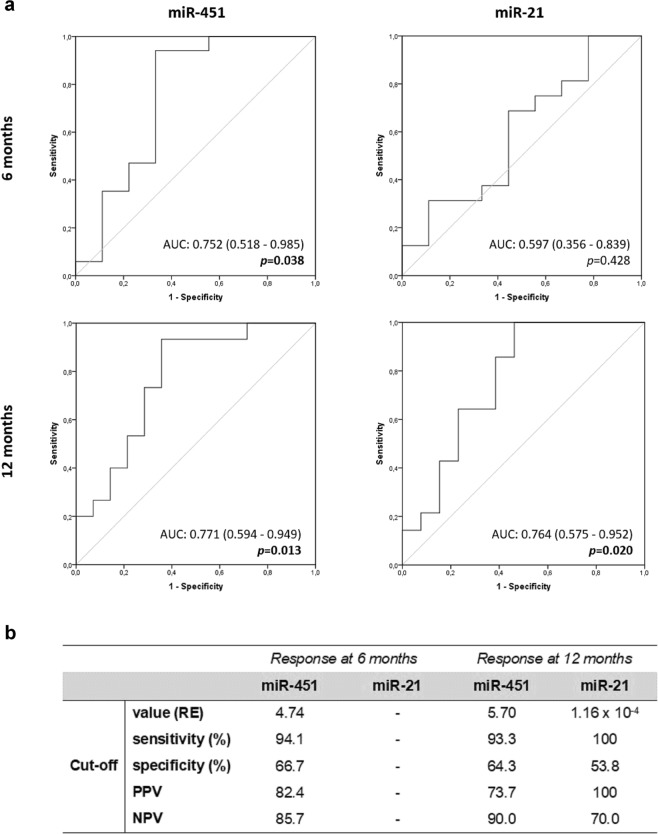
Figure 4.
Receiver Operating Characteristic (ROC) curve analysis of miR-451 and miR-21. ROC curves (a) and the identification of optimal cut-off values to discriminate optimal response (b) point-out the ability of miR-451 and miR-21 expression at diagnosis to predict response to TKI treatment at 6 months and 12 months. For each curve was represent the Area Under the Curve (AUC) and the respective p-value. RE–Relative Expression; PPV- Positive Predictive Value; NPV- Negative Predictive Value.

