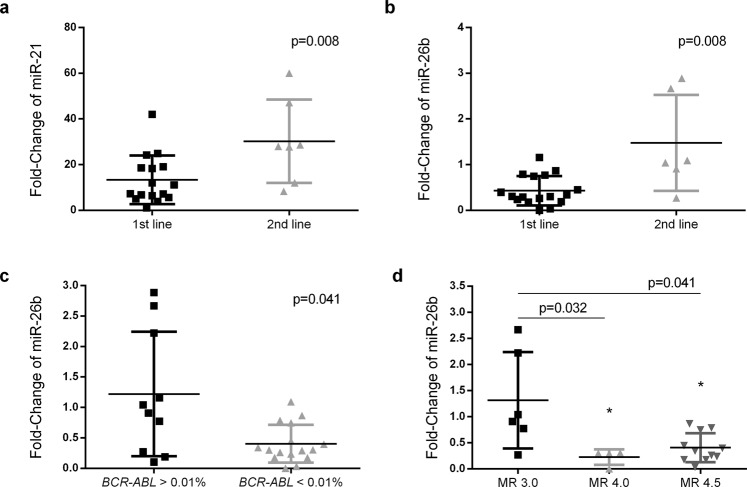
Figure 5.
Analysis of miR-21 and miR-26b fold-change in patients under TKI treatment. miR-21 (a) and miR-26b (b) fold-change were analysed according to the number of TKI that patients were exposed. The miR-26 expression levels were also studied in patients stratified according to BCR-ABL1 values (c) and to molecular response rates (d) Higher levels of miR-21 and miR-26b were detected in patients that fail 1st line of treatment, whereas miR-26b were down-regulated in patients with lower BCR-ABL1 levels and also in patients with deeper responses to treatment (MR 4.0 and MR 4.5). Statistical differences between groups are reported by the p-value.

