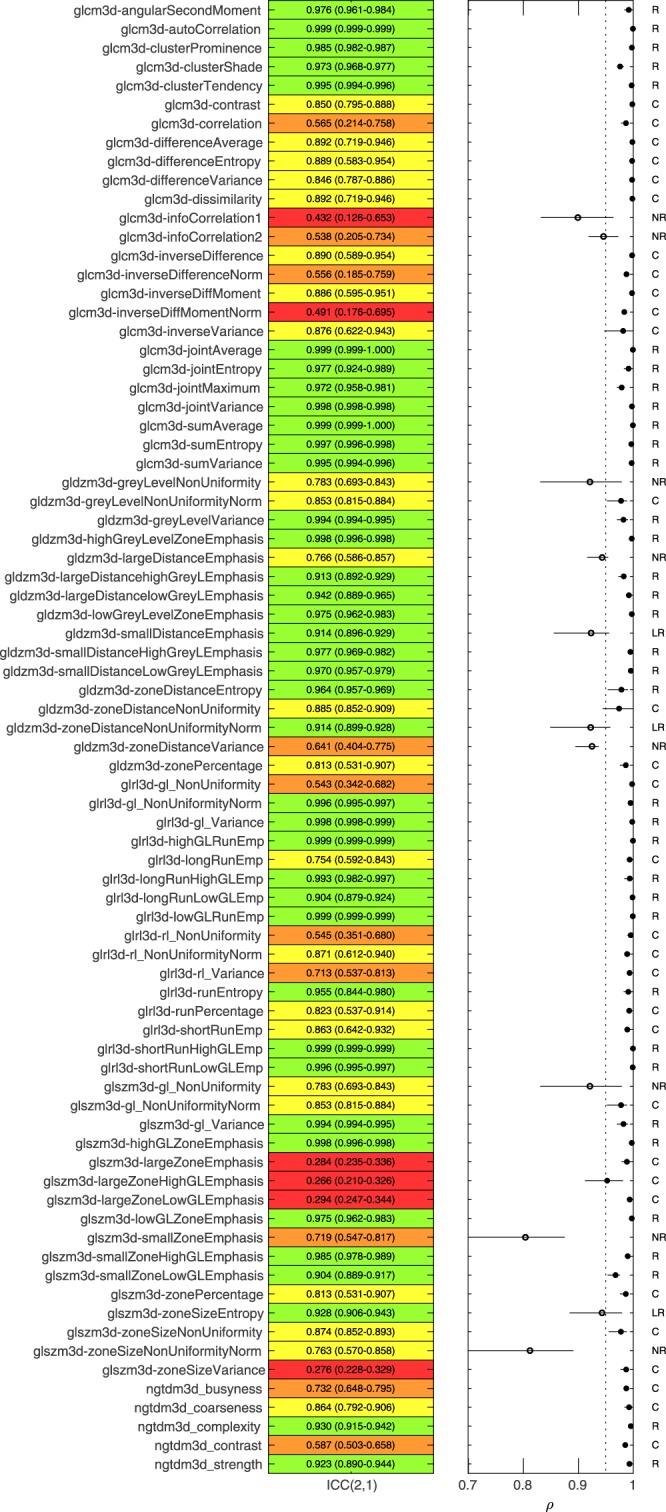
Figure 2.

Overview of robustness analysis to linear interpolation for 78 texture features. Left. ICC(2,1) with 95% confidence intervals for each feature. ICC highlighted in green (>0.9), yellow (0.75–0.9), orange (0.5–0.75) and red (<0.5). Right. Pairwise patient ranking correlation between the 2.7 mm rankings and all other voxel sizes for each feature. ρmean > 0.95 is highlighted with a closed dot. Features were categorised as R (Robust), LR, (limited Robustness), C (Potentially Correctable) and NR (Not Robust) based on criteria outlined in Fig. 1.
