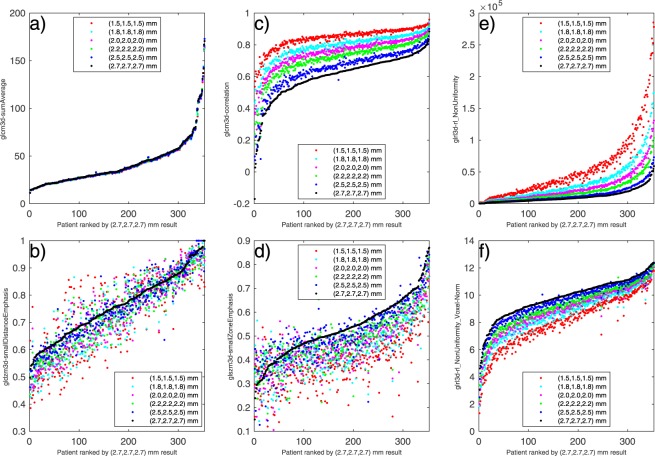
Figure 3.
Visualisation of response to linear interpolation for 6 selected features. Patient ranking was taken for the 2.7 mm dimension and plotted against the extracted feature values for all voxel dimensions. (a) Feature glcm3d-sumAverage, considered robust; (b) gldzm3d-smallDistanceEmphasis, limited robustness; (c) glcm3d-correlation, considered correctable; (d) glszm3d-smallZoneEmphasis, considered not robust. (e) glrl3d-rl_NonUniformity, considered correctable, and (f) glrl3d-rl_NonUniformity-Voxel-Norm, modified as suggested in7 to inherently include voxel number in the feature definition.

