Figure 6.

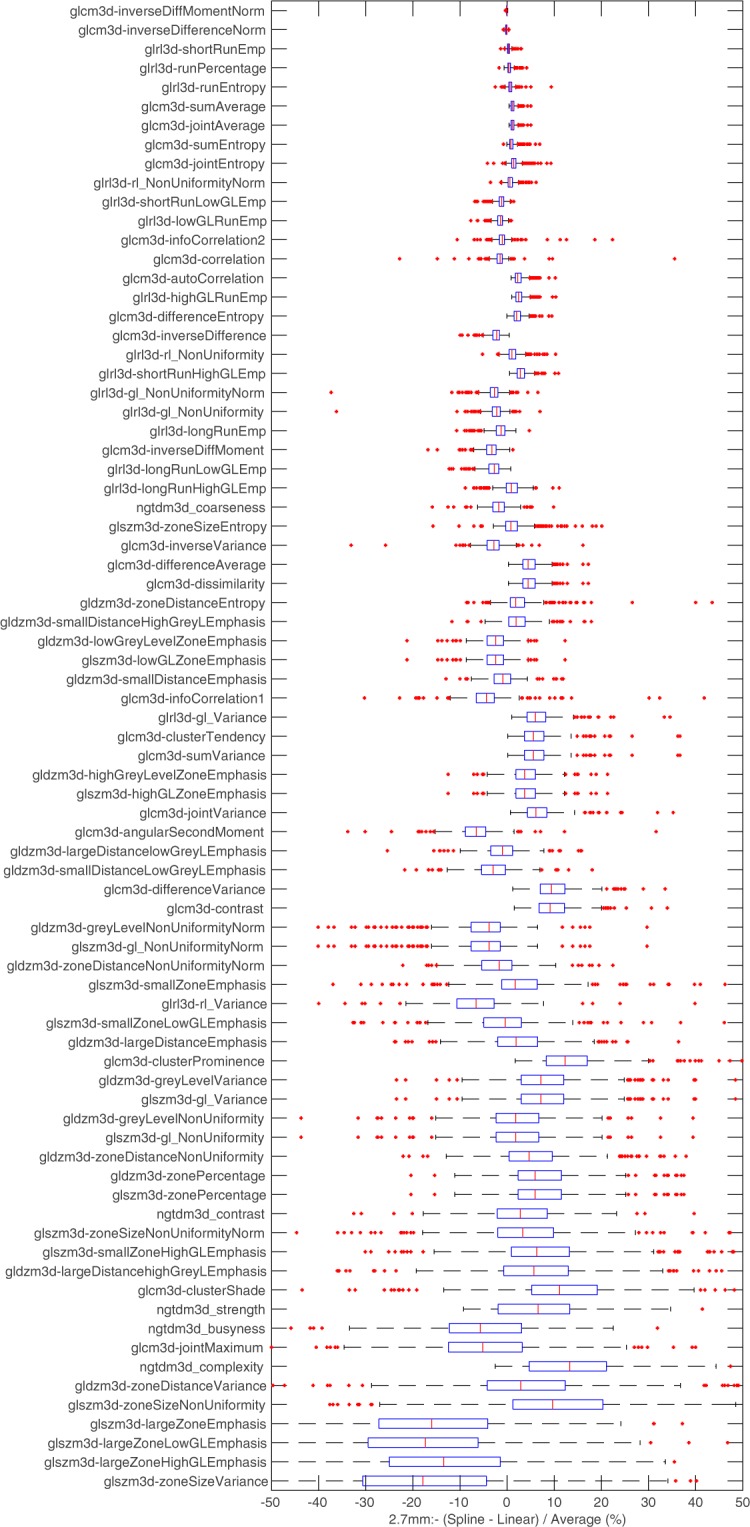
Boxplots summarising texture feature differences measured between (tri)-linear and spline interpolation. Features are ranked based on the interquartile range and the x axis has been limited between +/−50% for readability.

Boxplots summarising texture feature differences measured between (tri)-linear and spline interpolation. Features are ranked based on the interquartile range and the x axis has been limited between +/−50% for readability.