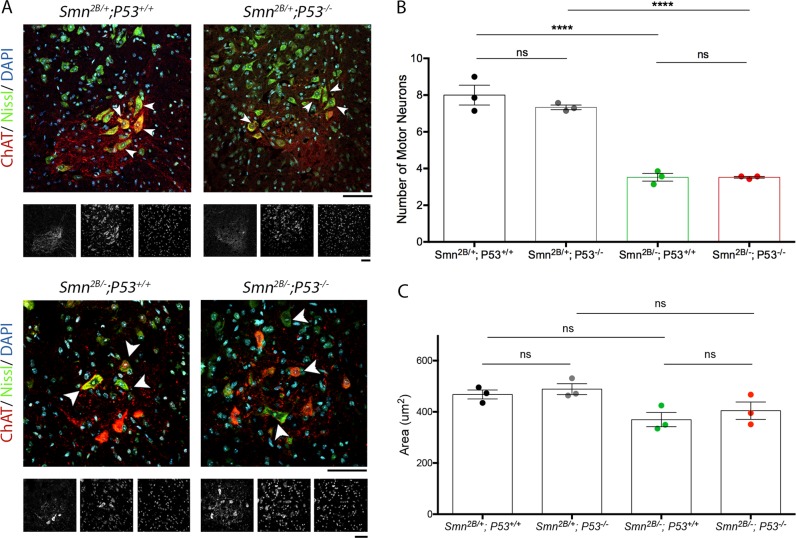
Fig. 5. Reducing P53 levels in Smn2B/− mice does not alter the number or size of MNCBs in the ventral horn of the spinal cord at P15.
a Representative images showing MNCBs in the ventral horn of the spinal cord at P15of Smn2B/+; P53+/+ and Smn2B/+; P53−/− mice and Smn2B/−; P53+/+ and Smn2B/−; P53−/− mice. White arrowheads point out MNCBs. The grayscale images shown below each coloured image are the sperate channels and show, from left to right, ChAT, Nissl and DAPI staining. Scale bar = 40 μm. b The graph (mean ± SEM) shows that when P53 is reduced there is no significant difference in the number of MNCBs in the ventral horn of both Smn2B/+ and Smn2B/− spinal cords at P15. There is a significant difference in the loss of MNCBs in Smn2B/− mice compared to Smn2B/+ mice (by one-way ANOVA; ns > 0.05, ****p < 0.001; n = 3 mice per genotype). c The graph (mean ± SEM) shows that when P53 is reduced there is no significant difference in the area of MNCBs in the ventral horn of both Smn2B/+ and Smn2B/− spinal cords (by one-way ANOVA; ns > 0.05; n = 3 mice per genotype)

