
Figure 1.
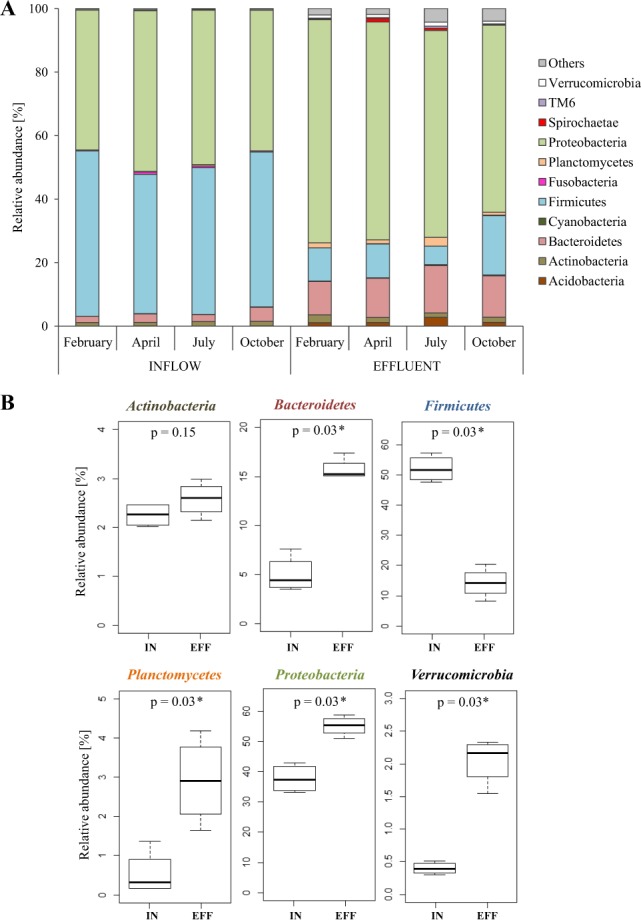
Relative abundance of dominant bacterial phyla (contributing more than 1% to the total bacterial community) in inflow and effluent samples after data rarefaction. (A) Bar charts show the percentage bacterial taxonomic composition for each sample. (B) Boxplots showing the average relative abundance of the dominant bacterial phyla between inflow and effluent. The p-value (p) indicates the significance of the differences based on a PERMANOVA with p < 0.05 being significant.