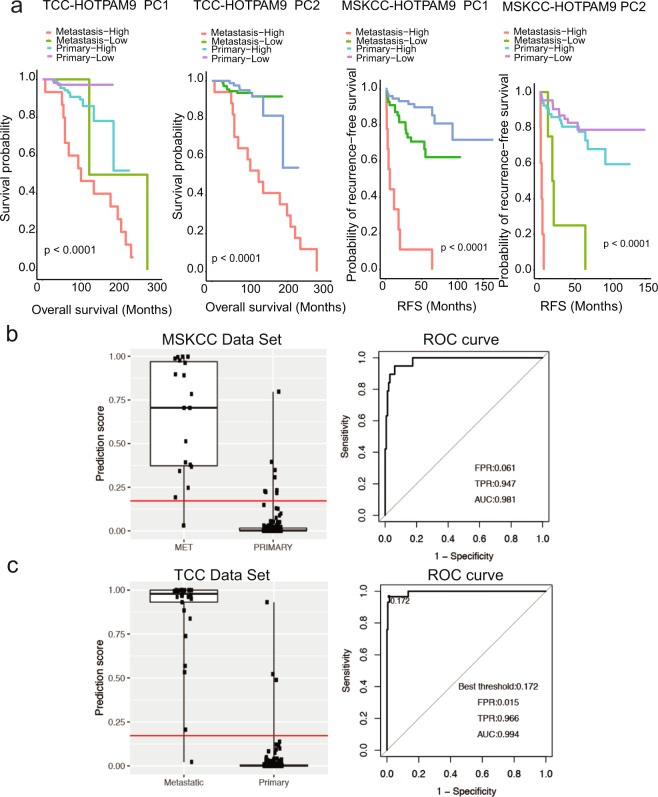
Figure 5.
Kaplan-Meier survival analysis based on categorized gene expression levels of the HOTPAM9 genes. (a) Kaplan-Meier survival curves based on categorized gene expression levels for all the HOTPAM9 genes (n = 223). Overall survival stratified based on high or low gene expression analysis for the Moffitt TCC data set. For all the HOTPAM9 genes the overall log rank test is significant. p value between primary groups is shown in each plot (left two panels). Kaplan-Meier Recurrence-Free survival (RFS) curves are based on categorized gene expression levels for all the HOTPAM9 genes (n = 173). For RFS in the MSKCC data set, the overall log rank tests are all significant (right two panels). (b) Performance of statistical stratification model built on the basis of gene expression data of CIT/STK21 and HSPB8 as biomarkers to distinguish indolent from aggressive disease in MSKCC training data set. Stratification scores for the aggressive disease were compared between patients with primary tumors and those with metastatic tumors (left). ROC curve analysis was used to evaluate an ability to distinguish patients with primary cancer from those with metastatic disease (right). (c) Performance of the stratification model on Moffitt TCC data set by dividing patients’ classification scores at the optimal threshold (left). ROC curve was used to evaluate overall performance of the stratification model (right).

