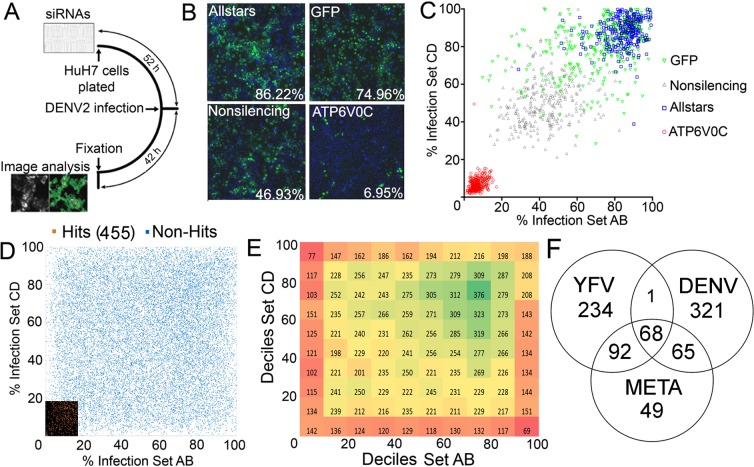
Figure 1.
An RNAi based screen for DENV2 human host factors. (A) Schematic describing the RNAi screen work flow. (B) Representative images from control wells. Infected cells are green and nuclei are blue. Rates of infection across the screen are indicated for each control. (C) Behavior of all control wells across the screen in terms of infection percentage. (D) Each point represents infection rate for wells AB and CD for a given gene. The 455 hits are highlighted in lower left corner. (E) Same data as in panel D plotted in deciles. The color represents numbers of genes in each square. (F) Venn diagram indicating numbers of host factor genes commonly identified between DENV and YFV RNAi screens, and identified by meta-analysis of both screens (see Materials and Methods).

