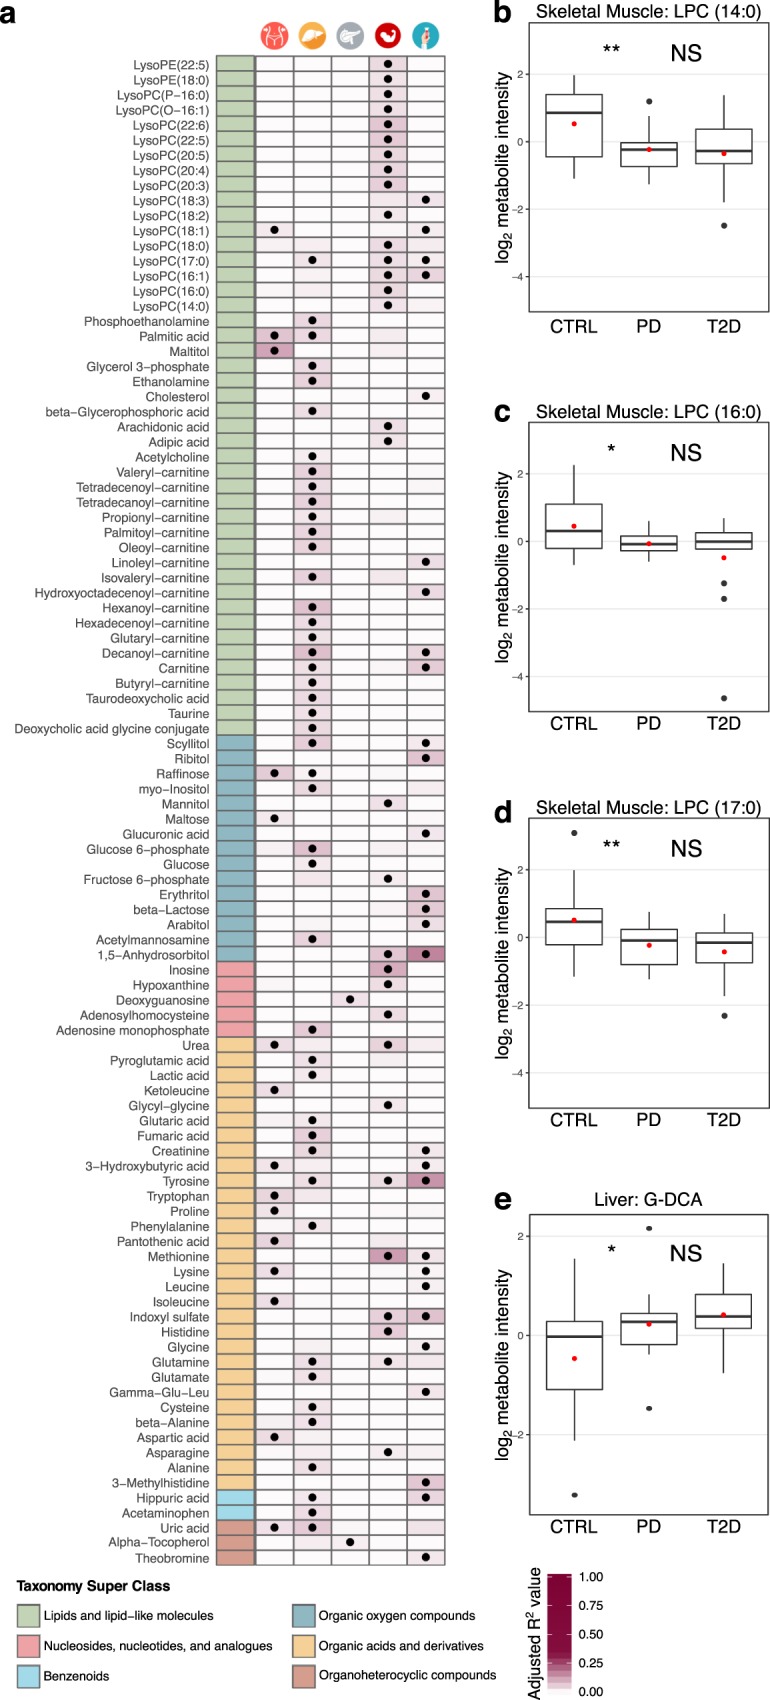
Figure 5.

(a) Overview of the metabolites that are significantly linearly associated with HbA1c in at least one tissue. The first column is color-coded according to a curated classification of the HMDB super-class taxonomy and the labels are explained in the legend. The following five columns represent each tissue as noted on the top of the heatmap. A black dot implies statistically significant association of the corresponding metabolite to HbA1c (linear regression permuted p-value < 0.1; Methods – Statistical analysis). The color intensity in the cell background shows the level of the adjusted R2 value from the linear regression model. (b–e) Pair-wise comparisons of levels of selected metabolites between controls (CTRL) and pre-diabetes (PD), and pre-diabetes (PD) and T2D subjects. Statistical significance is shown as follows: NS, p-value > 0.1; *0.1 ≥ p-value > 0.05; **0.05 ≥ p-value > 0.01) (Mann-Whitney U permuted test; Methods – Statistical analysis). The red dot signifies the mean value of the group. (b) Pair-wise comparisons of LPC (14:0) in skeletal muscle; (c) Pair-wise comparisons of LPC (16:0) in skeletal muscle; (d) Pair-wise comparisons of LPC (17:0) in skeletal muscle; (e) Pair-wise comparisons of deoxycholic acid glycine conjugate (G-DCA) in liver.
