
Figure 6.
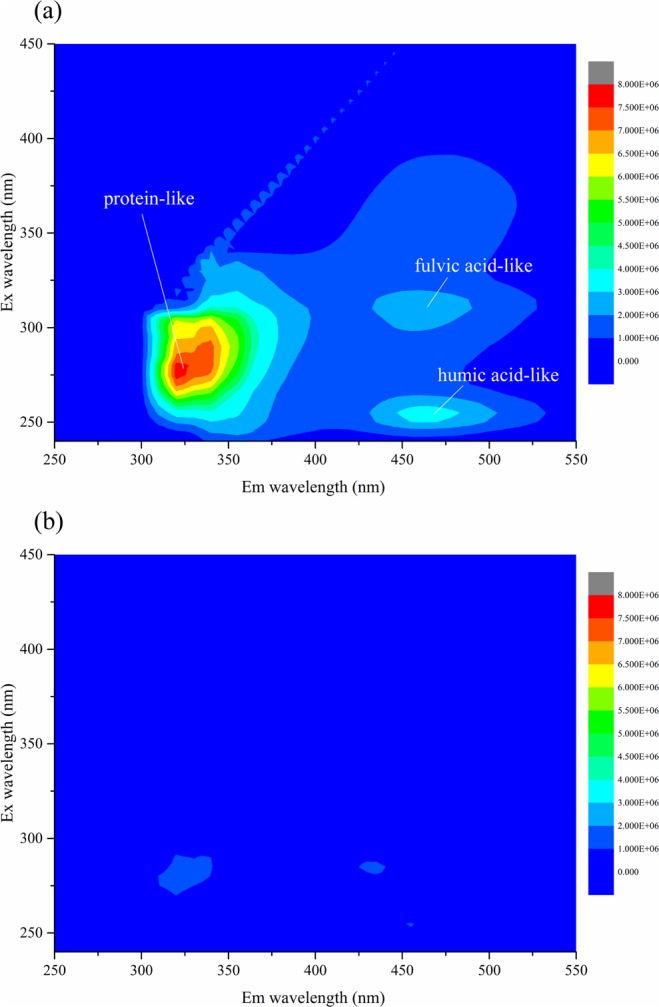
Variations in 3DEEM before and after the rapid Fenton process in full-scale plant: (a) BDFW, (b) Fenton. Experimental conditions: H2O2 dosage = 128 mg·L−1, [H2O2]:[Fe2+] mole ratio = 1:2, reaction time = 24 s, pH = 3–4.
Official websites use .gov
A
.gov website belongs to an official
government organization in the United States.
Secure .gov websites use HTTPS
A lock (
) or https:// means you've safely
connected to the .gov website. Share sensitive
information only on official, secure websites.
Variations in 3DEEM before and after the rapid Fenton process in full-scale plant: (a) BDFW, (b) Fenton. Experimental conditions: H2O2 dosage = 128 mg·L−1, [H2O2]:[Fe2+] mole ratio = 1:2, reaction time = 24 s, pH = 3–4.