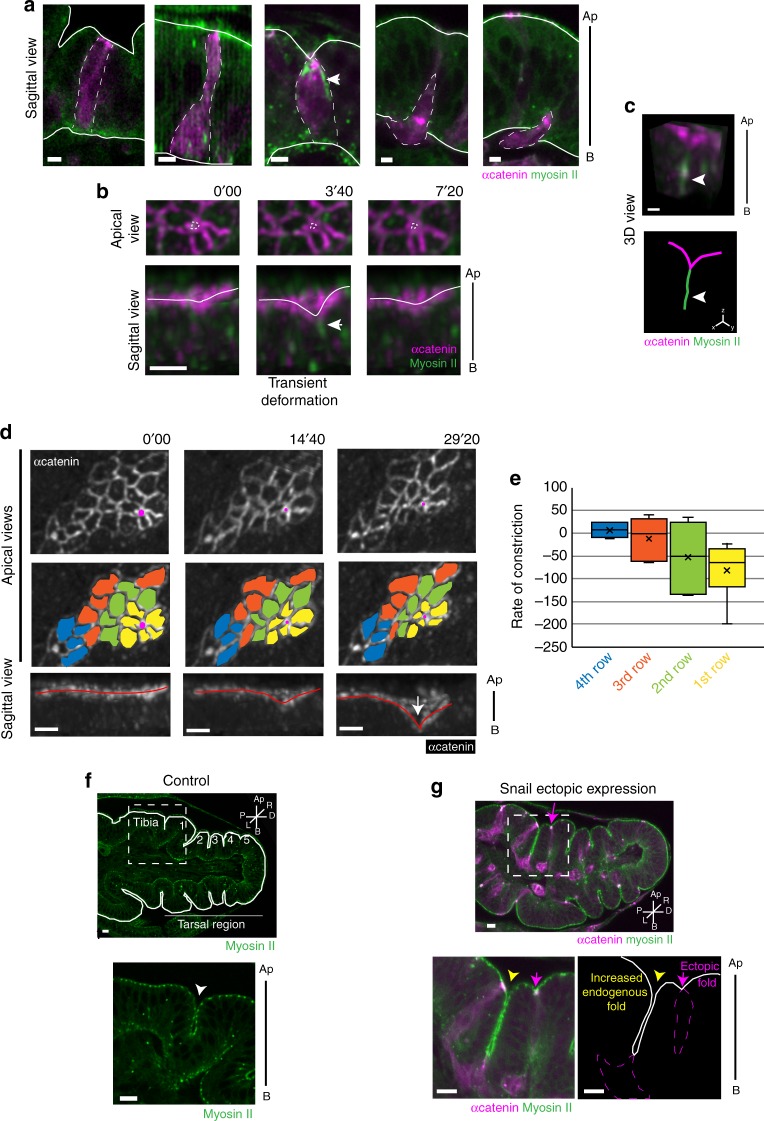
Fig. 2.
Cells undergoing EMT generate an apico-basal force actively involved in tissue folding. a–c Snail-expressing clones (marked by α-catenin-RFP in magenta) generated in sqh::sqh::GFP leg imaginal discs. a Images of fixed tissues recapitulating the successive steps of the delamination of cells undergoing EMT. A myosin II apico-basal structure is formed in a constricting cell (white arrowhead). Scale bar: 3 µm. b Time-lapse of a Snail-expressing clone, showing asynchronous apical constriction (apical view). While a cell constricts its apex (white dashed outline, apical view), a transient deformation appears at the apical surface (white outline, sagittal view), concomitant to an apico-basal myosin II structure (white arrowhead). Scale bar: 3 µm. c 3D reconstruction of a Snail-expressing clone and corresponding scheme showing the apical deformation generated by a pulling cell expressing Snail and the concomitant formation of a myosin II apico-basal structure (white arrowhead). See also Supplementary Movie 1. Scale bar: 1 µm. d Time-lapse images of a Snail-expressing clone. First (yellow), second (green), third (orange) and fourth (blue) row of neighbors from the delaminating cell (magenta) are color-coded to highlight their gradual constriction rate (apical views). The whole tissue ultimately produces a stable invagination (red outline, white arrow). See also Supplementary Movie 2. Scale bar: 3 µm. e Quantification of apical constriction rate in first (yellow), second (green), third (orange) and fourth (blue) row of neighbors from the delaminating cell (see Methods; n = 22 cells). f Sagittal sections of a control sqh::sqh::GFP leg disc and higher magnification of the tibia-T1 fold (arrows) as indicated in the general view (dotted square). Normal folds are outlined in white. Scale bar: 10 µm. g Sagittal section of a sqhKI[eGFP] leg disc with Snail-expressing clones (marked by α-catenin::RFP expression in magenta) with an ectopic fold formed in the T1 tarsal segment (magenta arrow). Higher magnifications of the tibia-T1 fold region is shown below. Note the deeper tibia-T1 fold (yellow arrowhead), compare to the control (in f). On the scheme (right) the Snail-expressing clones are outlined in magenta and the epithelium in white. See also Supplementary Fig. 1d−i and Supplementary Movie 3. Scale bar: 10 µm. Ap apical, B basal, P proximal, D distal, L left, R right

