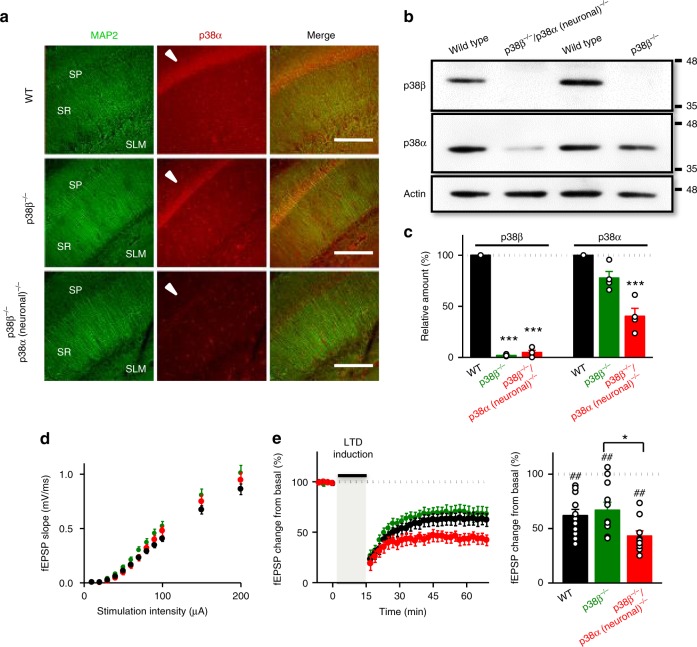
Fig. 6.
Neuronal p38α and p38β MAPK are not necessary for NMDAR-dependent LTD. a Immunohistochemistry of hippocampal sections from WT, p38β−/−, and p38β−/−/p38α (neuronal)−/− animals with anti-MAP2 antibody (green) and anti-p38α antibody (red). SP: stratum pyramidale (indicated with an arrowhead in middle panels). SR: stratum radiatum. SLM: stratum lacunosum moleculare. Scale bars, 200 μm. b Western blot analysis of p38α and p38β protein levels from WT, p38β−/−, and p38β−/−/p38α (neuronal)−/− hippocampus. Actin served as a loading control. c Relative amount in percentage of p38β and p38α from WT (black bars, n = 6), p38β−/−(green bars, n = 4), and p38β−/−/ p38α (neuronal)−/− (red bars, n = 4) from western blots as the one shown in b. Kruskal–Wallis test followed by Dunn’s test (***P < 0.001). d Input–output curves presenting fEPSP slope from acute hippocampal slices in response to increasing stimulus strength (n > 39 slices from n > 7 mice). No differences were found by two-way ANOVA (F(2, 240); P = 0.73). e (Left) Time course of relative changes in fEPSP slope before and after LFS in acute hippocampal slices from WT (black, n = 11 from 7 mice), p38β−/−/p38α neuronal)−/− (red, n = 9 slices from 7 mice) and p38β−/− (green, n = 11 from 7 mice) knockout mice. (Right) Summary of results from the end of the time courses shown on the left. Differences between groups were determined by Kruskal–Wallis test followed by Dunn’s test (*P < 0.05). Wilcoxon statistical test was used to analyze LTD expression with respect to baseline (##P < 0.01)

