Fig. 8.
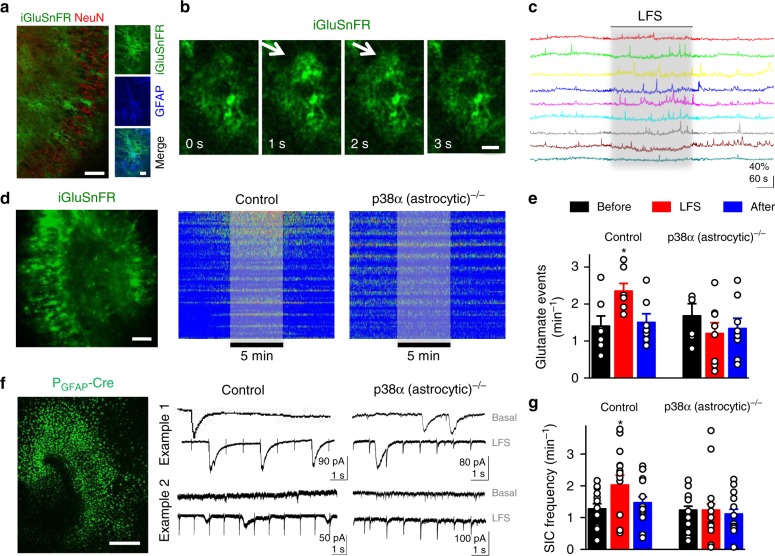
Astrocytic p38α is necessary for LFS-induced astrocyte-to-neuron communication. a Representative immunohistochemical localization of iGluSnFR, NeuN, and GFAP in organotypic hippocampal slices infected with AAV5-PGFAP-iGluSnFR. Right panels shown at higher magnification. Scale bars, 50 µm (left) and 30 µm (right). b Representative two-photon images of iGluSnFR fluorescence from individual astrocytes throughout time taken at 1 Hz. Arrows indicate a transient and local increase in glutamate-induced fluorescence. Scale bar, 20 µm. c Representative glutamate signals from the astrocytic surface before, during (gray beam) and after electrical LFS. Note the increased number of astrocyte iGluSnFR spikes during LFS. d Left, representative fluorescence image showing an organotypic hippocampal slice expressing iGluSnFR under GFAP promoter. Scale bar, 300 µm. Right, representative kymograph of glutamate activity (ROIs pooled from two different experiments were used), color-coded according to fluorescence changes from p38αlox/+ slices (left panel, Control) or from p38αlox/lox slices (right panel, p38α(astrocytic)−/−) infected with PGFAP-Cre virus. The period of LFS is highlighted. e Quantification of frequency of glutamate events from images as the ones represented in d. Glutamate events in control and GFAP-Cre infected p38αlox/lox slices were compared by Friedman test followed by Dunn's multiple comparison (*P < 0.05). Two-way repeated measures ANOVA demonstrated a significant interaction between AAV infection and the time of glutamate events. F(2;39) = 3.43, P = 0.04. Bonferroni post-hoc test: control vs. p38α (astrocytic)−/−. Data are presented as means ± s.e.m. f Left, Confocal image of an organotypic hippocampal slice from p38αlox/lox animals after 12 days viral transfection with AAV5-PGFAP-GFP-Cre. Scale bar, 300 µm. Right, two examples of whole-cell currents from pyramidal neurons in p38αlox/+ (left, Control) or p38αlox/lox (right, p38α(astrocytic)−/−) organotypic slices infected with PGFAP-Cre. g Frequency of SICs in basal conditions (before, black), during LFS (red) and after LFS (after, blue), binning of 5 min, quantified from recordings as the ones shown in f. SICs before, during and after LFS were compared by Friedman test followed by Dunns post-hoc test. Two way repeated measures ANOVA demonstrated a significant effect for AAV infection in SICs F(1;87) = 5.32; *P < 0.05. Bonferroni post-hoc test. Data are presented as means ± s.e.m. For statistical details see Supplementary Table

