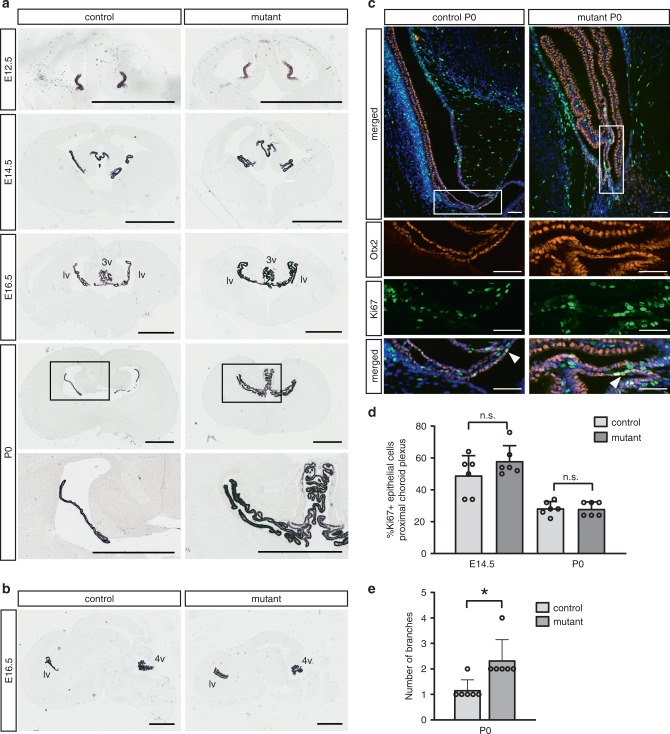
Fig. 5.
Mutant mice develop a larger mass of Ttr-expressing choroid plexus (CP). a, b Ttr expression detected by in situ hybridizations. a Coronal brain sections at the level of the lateral to third ventricle junction from different developmental stages. Note the increased number of CP tissue folds in the lateral and third ventricles of the P0 mutant brains. Enlarged regions of P0 sections are shown at the bottom. b Sagittal sections from E16.5 animals. Scale bars (a, b): 1 mm. c Immunostainings of P0 coronal brain sections containing the site of CP attachment to the ventricle wall (proximal CP). Otx2-positive CP epithelial cells (red), Ki67-positive cells (green), and DAPI-positive nuclei (blue) are shown. Lower panels display higher magnifications of the proximal CP region framed in the upper panel. Arrowheads point to Ki67-positive CP epithelial cells. Scale bars: 100 µm. d Percentage of Ki67-positive cells present in the proximal Otx2-positive CP tissue determined in E14.5 and P0 animals. The most proximal 50 cells starting from the attachment point of the CP were analyzed. The right and the left lateral ventricle of three control and three mutant animals of the same litter were investigated (six choroid plexi per group). Bars display the mean with standard deviations. p values (unpaired two-tailed Student’s t test): n.s. not significant. e Number of branches in CP tissue of P0 animals. The right and the left lateral ventricle of three control and three mutant animals of the same litter were investigated (six choroid plexi per group). Bars display the mean with standard deviations. p values (unpaired two-tailed Student’s t test): *p ≤ 0.05. Source data are provided as a Source Data file

