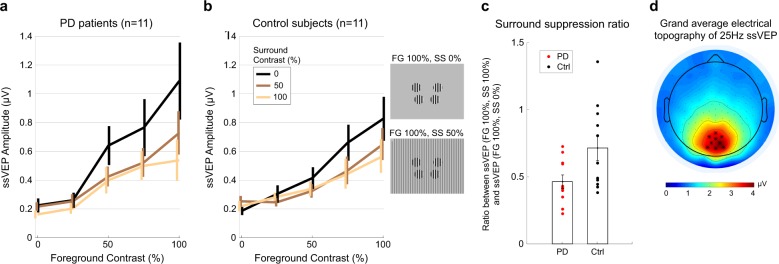
Fig. 3.
Contrast response functions for three different surround contrast conditions. a Patients with Parkinson’s disease (PD). b Control subjects. A fast Fourier transform (FFT) was computed for a 2240-ms window beginning 160 ms after stimulus onset to extract the single amplitude value at the frequency of stimulation 25 Hz. Contrast response functions are constructed from the ssVEP amplitude in each stimulus configuration of foreground (FG) and surround (SS) contrasts. Foreground stimulus varied across five levels of contrast: 0, 25, 50, 75, and 100%. Surround stimulus varied across three levels of contrast: 0% contrast (black trace), 50% contrast (brown trace), and 100% contrast (yellow trace). Insets show stimulus configurations for FG 100% embedded in SS of 0 and 50% contrast. c Surround-suppression ratio. Each point corresponds to a subject. The suppression ratio is computed as the ratio between the ssVEP amplitude for FG = 100%, SS = 100% and the ssVEP amplitude for FG = 100%, SS = 0%. Error bars indicate s.e.m. d Topographical distribution of the 25 Hz steady-state visual-evoked potential amplitude as a grand average between patients and control subjects, for trials with 75 or 100% contrast foreground embedded in a midgray surround (0% contrast). The cluster of electrodes chosen to measure and statistically test ssVEP amplitude are marked with star symbols

