Fig. 4.
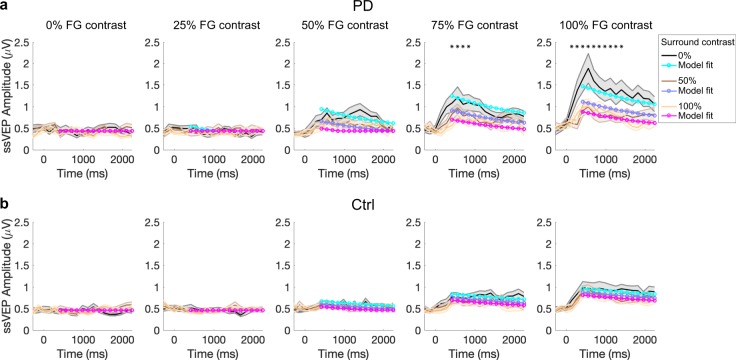
Temporal analysis. a Patients with PD. b Control subjects. The group-average ssVEP amplitude was tracked over the duration of the visual stimulation, with stimulus onset at 0 ms. We computed a short-time Fourier transform (STFT) on sliding windows of 560 ms with an overlap of 75% over the 2.4-s trial length, starting from 280 ms prior to stimulus onset. Temporal response profiles for increasing FG contrasts are plotted from left to right (0, 25, 50, 75, 100%) and each of the three surround contrasts are superimposed in each plot (black for 0%, brown for 50%, yellow for 100% contrast). The colored lines in cyan, purple, and magenta represent the model fit to the data, in which FG and divisive surround drives each exponentially decay (i.e., adapt) to varying degrees. Shaded error bars indicate mean ± s.e.m. Asterisks indicate timepoints with significantly higher amplitude of the visual response (ssVEP) in patients, reached for foreground stimulus of 75 and 100% contrast with surround contrast of 0% (p < 0.05 in bootstrapping analysis)

