
Figure 3.
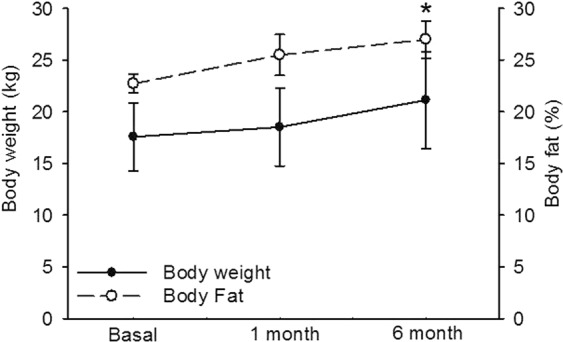
Body weight and fat in dogs females in basal conditions, first and sixth month after performing the OSH. Basal conditions vs. after six months (*p = 0.04). Values expressed as mean ± standard error (n = 12).
Official websites use .gov
A
.gov website belongs to an official
government organization in the United States.
Secure .gov websites use HTTPS
A lock (
) or https:// means you've safely
connected to the .gov website. Share sensitive
information only on official, secure websites.
Body weight and fat in dogs females in basal conditions, first and sixth month after performing the OSH. Basal conditions vs. after six months (*p = 0.04). Values expressed as mean ± standard error (n = 12).