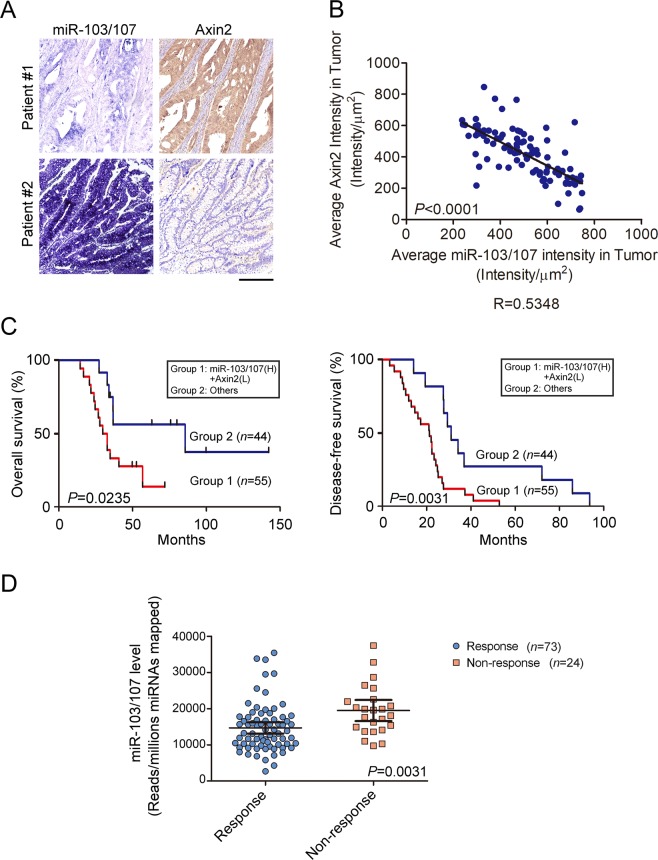
Figure 7.
MiR-103/107-Axin2 axis correlates with poor prognosis of CRC patients. (A) Representing ISH staining for miR-103/107 expression and IHC staining for Axin2 expression in two CRC patient specimens. Bar, 50 mm. (B) Inverse correlation of miR-103/107 expression and Axin2 expression in CRC specimens. Pearson correlation test was used for comparison between groups. (C) Kaplan–Meier analysis of overall survival and disease-free survival of CRC patients with the corresponding expression profiles. Log-Rank test was used for comparison between groups. (D) Comparison of miR-103/107 level by response of patients to oxaliplatin treatment. Response group includes complete or partial response, while non-response one includes stable or progressive disease. Data are mean ± S.D.

