
Figure 1: Principle of fluorescence correlation spectroscopy (FCS) for point confocal microscopes.
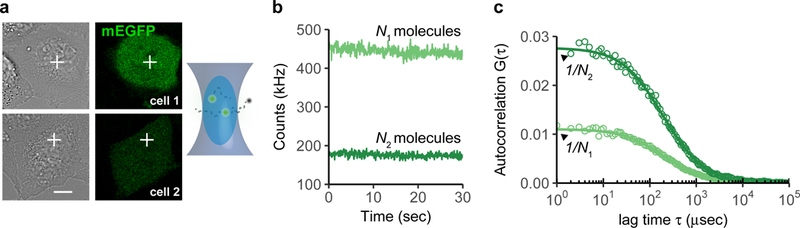
(a) The excitation laser beam is positioned to a specific location of a cell. Fluorophores entering the confocal volume are excited and the number of photons emitted is recorded. Shown are two cells expressing different levels of the fluorescent protein mEGFP. Scale bar 10 μm.
(b) The fluctuations of the fluorophores diffusing in and out of the confocal volume cause fluctuations in the number of photons.
(c) Computing the self-similarity of the fluctuations in (b) yields auto-correlation functions (ACFs). The amplitude of the ACF is directly proportional to the inverse of the number of molecules observed on average in the confocal volume.