
Figure 3: Example of image quantification using FCS calibration.
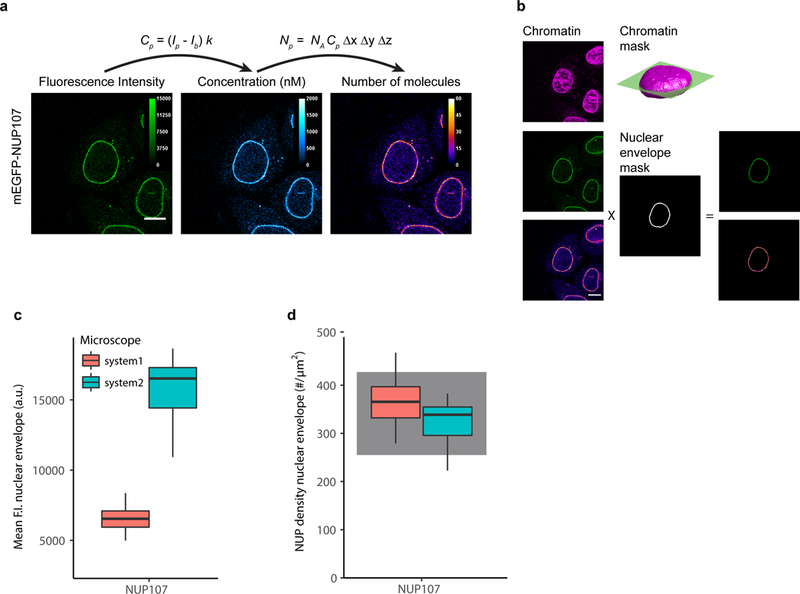
(a) The fluorescence intensity at each pixel, Ip, is converted to concentrations and protein numbers (for 3D and 4D images). The images are acquired with the same imaging parameters as the images used to compute the FCS calibration curve. Shown is data for a HeLa Kyoto cell line with endogenous NUP107 tagged N-terminally with mEGFP. Scale bar 10 μm.
(b) The quantitative distribution of a POI can be derived by using markers for cellular structures. DNA stained with SiR-DNA is used to compute a 3D chromatin mask of the nucleus. In the equatorial plane, a three pixel wide rim defines the nuclear envelope. Fluorescence intensities and protein numbers on the nuclear envelope can then be calculated. Scale bar 10 μm.
(c) mEGFP-NUP107 average fluorescence intensity on the nuclear envelope. Data shows results obtained on two different microscopes. The boxplots show median, interquartile range (IQR), and 1.5*IQR (whiskers), for n = 16–22 cells and 2 independent experiments on each microscope. System 1: LSM880, FCS and imaging using the 32 channel GaAsP detector. System2: LSM780, FCS using the APD detector (Confocor-3), imaging using the 32 channel GaAsP detector.
(d) Conversion of fluorescence intensity to protein numbers using the corresponding calibration curve obtained for each experiment and microscope system (not shown). The protein density on the nuclear envelope has been computed according to Eq. S24 (Supplementary Note 6). The gray shadowed boxes show the expected protein numbers for NUP107 18,19.