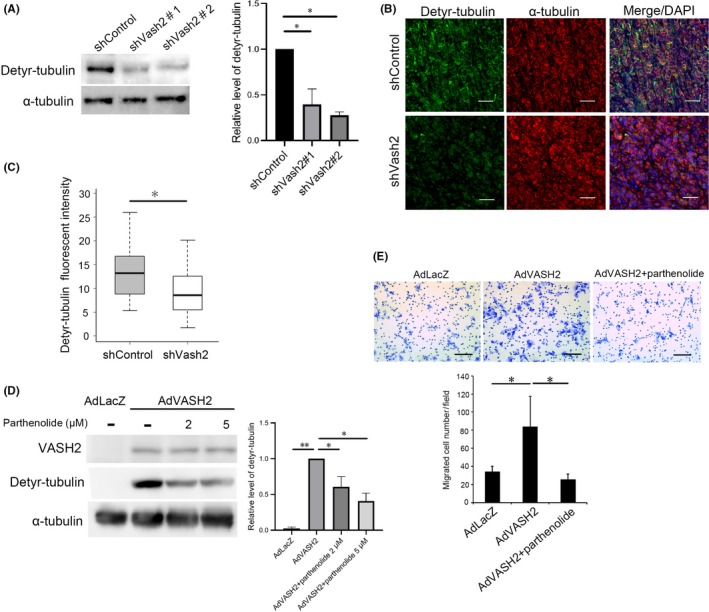
Figure 4.

Vasohibin‐2 (Vash2) increased α‐tubulin detyrosination for cancer cell migration. A, Western blotting of detyrosinated α‐tubulin and total α‐tubulin in KPC/shControl and KPC/shVash2 clones was carried out (n = 3). Quantification of the western blotting is shown on the right. B, Representative images of double fluorescent immunohistochemical staining for detyrosinated α‐tubulin (green), total α‐tubulin (red) in the orthotopic tumors formed by KPC/shControl and KPC/shVash2 clones. C, Quantification of detyrosinated α‐tubulin immunofluorescence intensity (n = 4). D, Western blotting of VASH2, detyrosinated tubulin and α‐tubulin in SUIT‐2 cells infected with AdLacZ or AdVASH2 and treated with DMSO (‐) or indicated concentration of parthenolide for 48 h. Quantification data are shown on the right. E, SUIT‐2 cells were infected with AdLacZ or AdVASH2 and incubated for 48 h. Thereafter, migration assay was carried out in the presence of DMSO (‐) or 5 μmol/L parthenolide (n = 3). Quantification of the western blotting is shown on the right. Error bars represent standard deviation (SD). Scale bars are 100 μm. *P < .05, **P < .01
