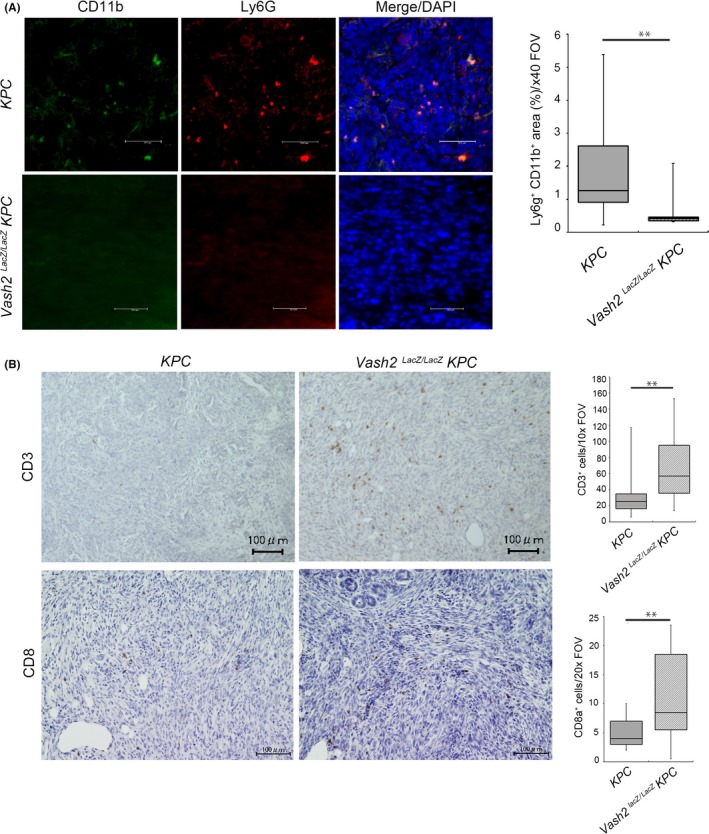
Figure 7.

Vasohibin‐2 (Vash2) modulated myeloid derived suppressor cell accumulation and T‐cell infiltration in pancreatic ductal adenocarcinoma (PDAC). A, Representative images and quantification of CD11b and Ly6G double‐positive area in spontaneous PDAC tumor of KPC mice and Vash2 LacZ/LacZ KPC mice. (n = 7). B, Immunohistochemical (IHC) staining of CD3 and CD8 in the tumors. Boxplots on the right show quantification of cells stained with the indicated antibodies (n = 7). Mice were killed at endpoint and used for IHC. Scale bars are 100 μm. *P < .05, **P < .01
