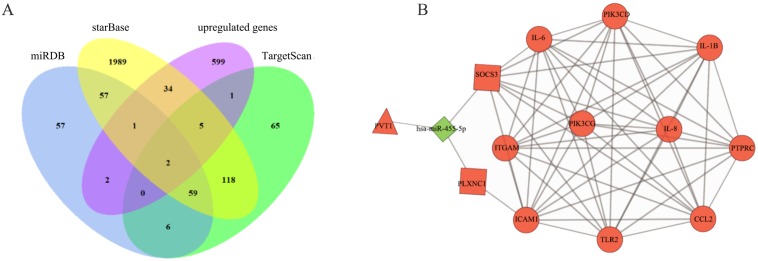
Figure 6. Construction of ceRNA network in pulpitis.
(A) Venn diagram showing the number of distinct and overlapping RNAs among the upregulated genes and the RNAs identified with miRDB, starBase, and TargetScan. The overlapping areas show the upregulated genes identified by three online tools. (B) Interaction of RNAs in the PVT1-associated ceRNA network. The triangle node and the diamond node represent the lncRNA and miRNA, respectively. The rectangle nodes represent miR-455-5p-targeted mRNAs. The round nodes are the top 10 hub DEmRNAs in the network. The up- and downregulated genes are colored in red and green, respectively.

