
Figure 1. Baseline profiling of CD4 T‐cell differentiation subsets stratifies clinical responses to PD‐L1/PD‐1 blockade.
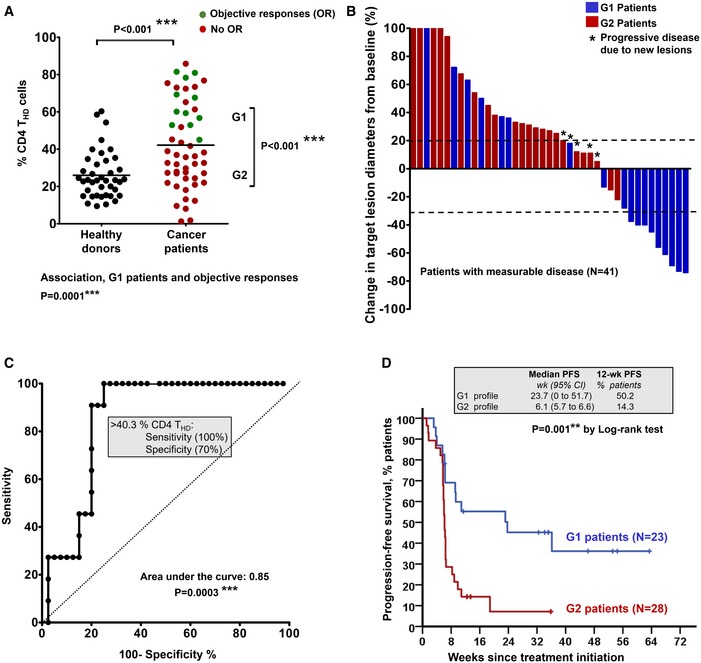
- Percentage of circulating highly differentiated CD4 T cells within CD4 cells in age‐matched healthy donors (N = 40) or NSCLC patients (N = 51) or NSCLC patients before undergoing immunotherapies. G1 and G2, groups of patients classified according to high THD cells (G1, > 40% CD4 THD cells) and low THD cells (G2, < 40% CD4 THD cells). Relevant statistical comparisons are shown by the test of Mann–Whitney. In green, objective responders (OR). In red, no OR. Below the graph, correlation of objective responses to G1 and G2 groups by Fisher's exact test.
- Waterfall plot of change in lesion size in patients with measurable disease classified as having a G1 (blue) or G2 (red) profile. Dotted lines represent the limit to define significant progression (upper line) or significant regression (lower line).
- ROC analysis of baseline CD4 THD quantification as a function of objective clinical responses.
- Kaplan–Meier plot for PFS in patients treated with immunotherapies stratified only by G1 (green) and G2 (red) CD4 T‐cell profiles. Patients starting therapy with a G2 profile had an overall response rate (ORR) of 0 and 82% of them experienced progression or death by week 9. ORR was 44.8% for G1 patients, and the 12‐week PFS was 50.2%.
Source data are available online for this figure.