
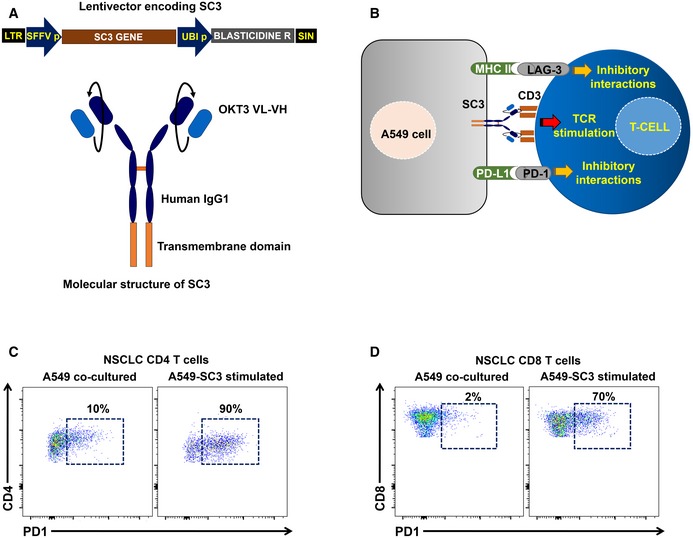
Figure EV3. Ex vivo human lung adenocarcinoma T‐cell recognition system.
-
ATop, lentivector co‐expressing an anti‐CD3 single‐chain antibody gene (SC3) and blasticidin resistance for selection. SFFVp, spleen focus‐forming virus promoter; UBIp, human ubiquitin promoter; LTR, long terminal repeat; and SIN, U3‐deleted LTR leading to a self‐inactivating lentivector. Bottom, molecular structure of the SC3 molecule, which is anchored to the cell membrane by a transmembrane domain as indicated. OKT3 VL, variable region of the light chain from the anti‐CD3 antibody OKT3; VH, variable region of the heavy chain from the anti‐CD3 antibody OKT3.
-
BScheme of the cell‐to‐cell interactions mediated by the lentivector‐modified A549 cell and T cells including SC3/CD3, PD‐L1/PD‐1, and MHCII/LAG‐3 interactions as indicated.
-
C, DRepresentative flow cytometry density plots with the upregulation of PD‐1 expression in CD4 (C) and CD8 T cells (D) from NSCLC patients following co‐incubation with A549‐SC3 cell as indicated (right graph), or with unmodified A549 control (left graph). Percentages of PD‐1+ T cells are shown within the graphs.