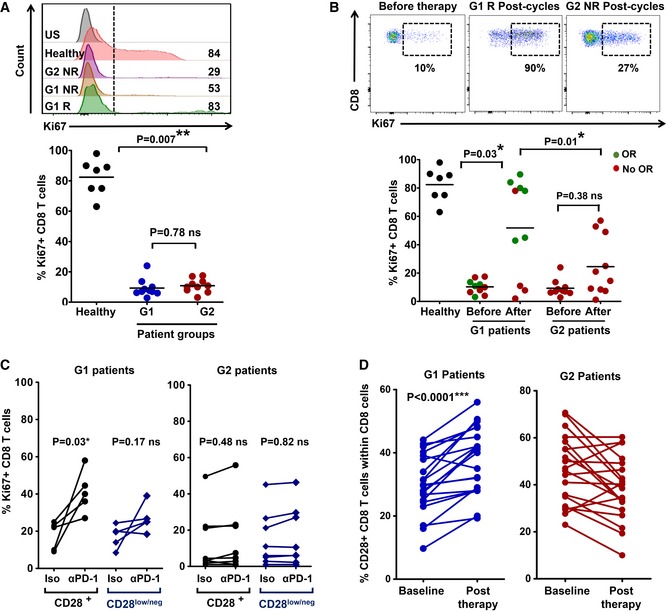
Upper flow cytometry histograms, expression of the proliferation marker Ki67 in CD8 T cells from the indicated patients or healthy donor before the start of immunotherapy, stimulated ex vivo by A549‐SC3 cells. Numbers indicate mean fluorescence intensities. G1 R and G1 NR, responder and non‐responder G1 patient, respectively; G2 NR, non‐responder G2 patient. US, unstained control. Below, same as above but as a dot plot graph with percentage of proliferating Ki67+ CD8 T cells from the indicated groups (n = 7–10). Relevant statistical comparisons are shown with the test of Mann–Whitney.
Upper flow cytometry density plots, expression of Ki67 in ex vivo‐stimulated CD8 T cells from the indicated patients before and after the start of immunotherapies. NR, non‐responder patient; R, responder patient. Below, dot‐plots of the percentage of Ki67+ proliferating CD8 T cells after ex vivo activation by A549‐SC3 cells. CD8 T cells were obtained from samples of G1 or G2 patients before immunotherapy and after three cycles of anti‐PD‐1 therapy (n = 7–10). Relevant statistical comparisons are shown with the test of Mann–Whitney. Green, objective responders (OR) and red, no ORs.
Same as in (A) but in the presence of an isotype control antibody or an anti‐PD‐1 antibody molecularly equivalent to pembrolizumab. Relevant statistical comparisons are shown with comparisons carried out with paired Student's t‐test.
Change in CD8 CD28+ T cells from baseline to post‐therapy in G1 patients (left) or in G2 patients (right). Statistical comparisons were carried out with paired Student's t‐test.