
Figure EV5. Systemic CD8 responses in NSCLC patients.
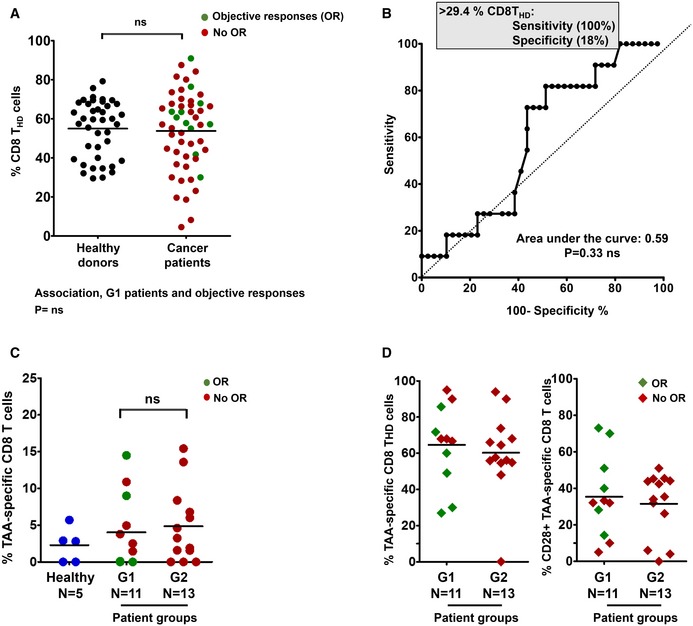
- Percentage of circulating highly differentiated CD8 cells in age‐matched healthy donors (n = 40) and NSCLC patients (n = 51) before undergoing immunotherapies. Relevant statistical comparisons are shown by the test of Mann–Whitney. In green, objective responders (OR). In red, no OR.
- ROC analysis of baseline CD8 THD quantification as a function of objective clinical responses.
- Dot‐plot of lung cancer antigen‐specific CD8 T cells obtained before the start of immunotherapies and stimulated with A549‐loaded autologous DCs autologous DC in healthy donors (n = 5), G1 (n = 11) and G2 (n = 13) patients, as indicated. Relevant statistical comparisons are indicated by the test of Kruskal–Wallis.
- Left dot‐plot, percentage of CD28‐negative CD8 T cells within TAA‐specific CD8 subsets in G1 (n = 11) and G2 (n = 13) patients, as indicated. Right dot‐plot, same as left but with CD28‐positive subsets. Green, objective responders (OR) and red, no ORs. N, number of biological replicates (independent patients).