
Figure 6. PD‐1/LAG‐3 co‐blockade recovers proliferative capacities of CD4 and CD8 T cells from G2 patients.
-
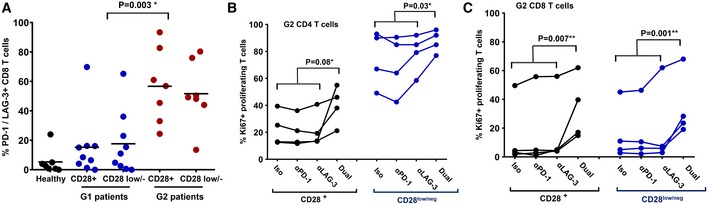
AScatter plots of PD‐1/LAG‐3‐expressing CD8 T cells after activation by A459‐SC3 cells in a sample of G1 (n = 9) and G2 (n = 7) patients within CD28+ and CD28negative populations as indicated in the figure. Relevant statistical comparisons are shown with the test of Kruskal‐Wallis.
-
B, CDot‐plot representing the percentage of proliferating CD4 T cells (B) and CD8 T cells (C) from a sample of G2 patients before starting immunotherapy, activated ex vivo by A549‐SC3 cells in the presence of the indicated antibodies. “Dual” represents the addition of both anti‐PD‐1 and anti‐LAG‐3 antibodies. Appropriate statistical comparisons are shown within the graph with two‐way paired ANOVA. Data from CD28+ and CD28negative subsets are represented as indicated.