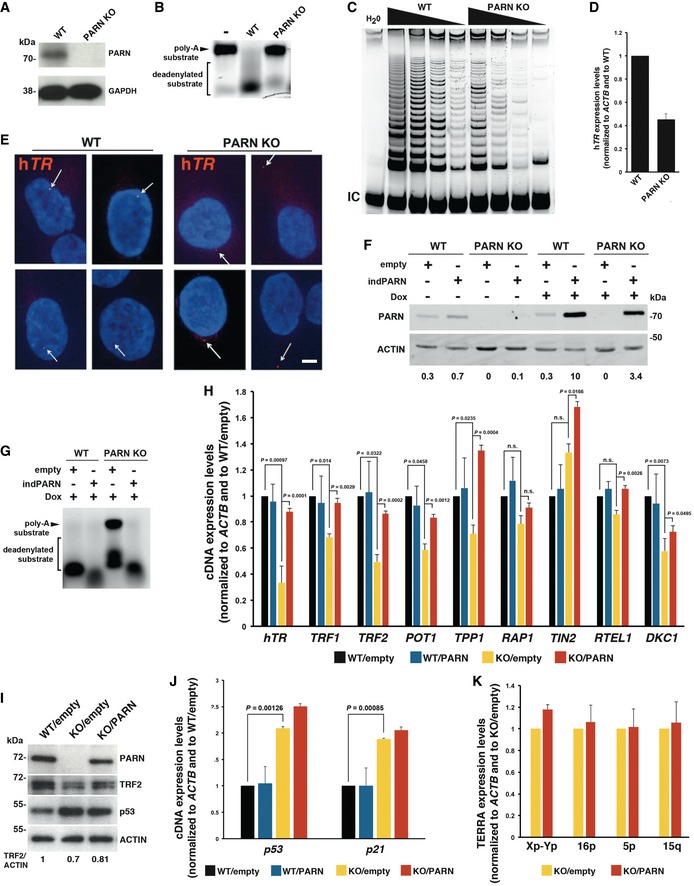
Validation of PARN KO in HT1080 cells by Western blot. GAPDH is used as loading control.
In vitro deadenylation activity assay using protein extracts from HT1080 (WT) and HT1080PARN KO (PARN KO) cells.
TRAP assay using successive dilutions (500, 250, 125, and 62.5 ng) of cell extracts from WT or PARN KO cells. An internal control (IC) for PCR was used.
qRT–PCR analysis of hTR expression in WT and PARN KO cells. Expression levels were normalized first to ACTB and then to WT. Three independent RNA extractions were performed for each cell line. Error bars indicate s.e.m.
Representative pictures of FISH against hTR in WT and PARN KO cells. Arrows indicate hTR foci. Scale bar 5 μm.
PARN detection by Western blot in the indicated conditions. Expression was induced by incubating cells with 10 ng/ml doxycycline for 72 h. Actin is used as loading control. PARN/actin ratios, normalized to doxycycline‐treated WT/PARN cells, are shown below.
In vitro deadenylation activity assay using protein extracts from doxycycline‐treated WT/empty, WT/PARN, KO/empty, and KO/PARN cells.
qRT–PCR analysis of the indicated gene transcripts in doxycycline‐treated WT/empty, WT/PARN, KO/empty, and KO/PARN cells. Expression levels were normalized first to ACTB and then to WT/empty. Three independent doxycycline inductions were performed for each cell line. Averages are shown, and error bars indicate s.e.m. Unpaired Student's t‐tests were applied.
Representative Western blot analysis of PARN, TRF2, and p53. Actin was used as loading control. Mean TRF2/actin levels from two independent experiments are indicated below.
Same as (H) for p53 and p21 transcripts. Averages are shown, and error bars indicate s.e.m. Unpaired Student's t‐tests were applied. Three independent doxycycline inductions were performed for each cell line.
qRT–PCR analysis of TERRA from the indicated chromosome ends in doxycycline‐treated KO/empty and KO/PARN cells. Expression levels were normalized first to ACTB and then to KO/empty. Three independent doxycycline inductions were performed for each cell line. Error bars indicate s.e.m.

