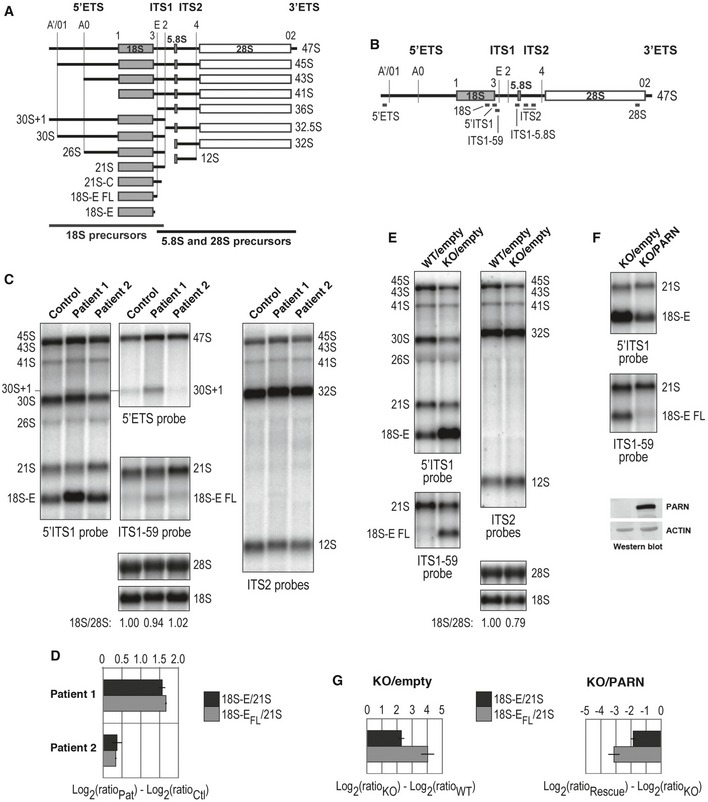
Schematic representation of human ribosomal precursors with rRNAs sequences displayed as gray (18S, small ribosomal subunit) or white boxes (5.8S and 28S rRNAs, large ribosomal subunit). These three rRNAs are flanked by external (5′ETS, 3′ETS) and internal transcribed spacers (ITS1, ITS2). The position of endonucleolytic cleavages is represented by vertical lines along these transcribed spacers or corresponds to 5′ and 3′ ends of rRNA sequences.
Graphical representation of DNA probes used for Northern blot hybridization displayed along the 47S primary rRNA transcript.
Northern blot analysis of pre‐rRNAs from control and patient B‐LCLs.
Log2 values of 18S‐E/21S and 18S‐EFL/21S for P1 and P2 were normalized to the values of the control and presented in a graphical format, with Log averages ± standard deviation for two independent experiments.
Northern blot analysis of pre‐rRNAs from HT1080PARN WT and HT1080PARN KO cells, transduced with an empty vector.
Ectopic expression of PARN was induced in HT1080PARN KO cells and compared to cells transduced with an empty vector. Western blot relative to actin assessed PARN levels.
Quantitative analyses of 18S‐E/21S and 18S‐E FL/21S ratios were as described in (D) for HT1080PARN KO cells relative to HT1080PARN WT (left panel; see (E)) and for HT1080PARN KO cells rescued by ectopic expression of PARN relative to HT1080PARN KO cells transduced with an empty expression vector (right panel; see (F)), with Log averages ± standard deviation for four independent experiments.

