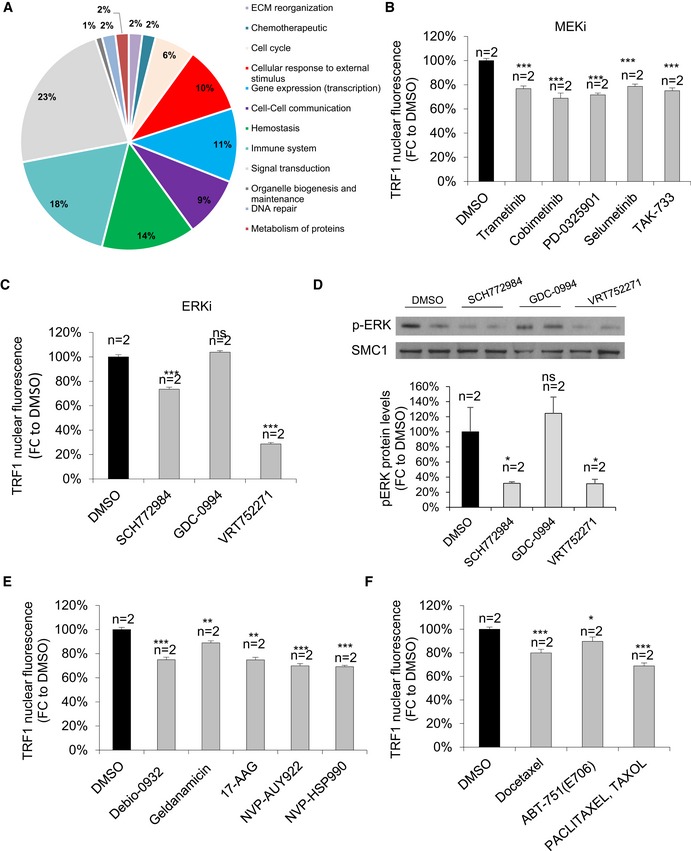
Figure EV1. Validation of the novel pathways of TRF1 regulation.

-
ARepresentative image of the pathways included in Reactome database.
-
BQuantification of TRF1 nuclear fluorescence in CHA9‐3 lung cancer cells treated with DMSO or structurally different MEK inhibitors for 24 h at 1 μM. Data are representative of n = 2 biological replicates
-
CQuantification of TRF1 nuclear fluorescence in CHA9‐3 lung cancer cells treated with DMSO or structurally different ERK inhibitors for 24 h at 1 μM. Data are representative of n = 2 biological replicates
-
DWestern blot images (up) and p‐ERK protein levels (down) of CHA9‐3 lung cancer cells treated with the indicated compounds for 24 h at 1 μM. Data are representative of n = 2 biological replicates
-
EQuantification of TRF1 nuclear fluorescence in CHA9‐3 lung cancer cells treated with DMSO or structurally different HSP90 inhibitors for 24 h at 1 μM. Data are representative of n = 2 biological replicates
-
FQuantification of TRF1 nuclear fluorescence in CHA9‐3 lung cancer cells treated with DMSO or different tubulin agents for 24 h at 1 μM. Data are representative of n = 2 biological replicates.
