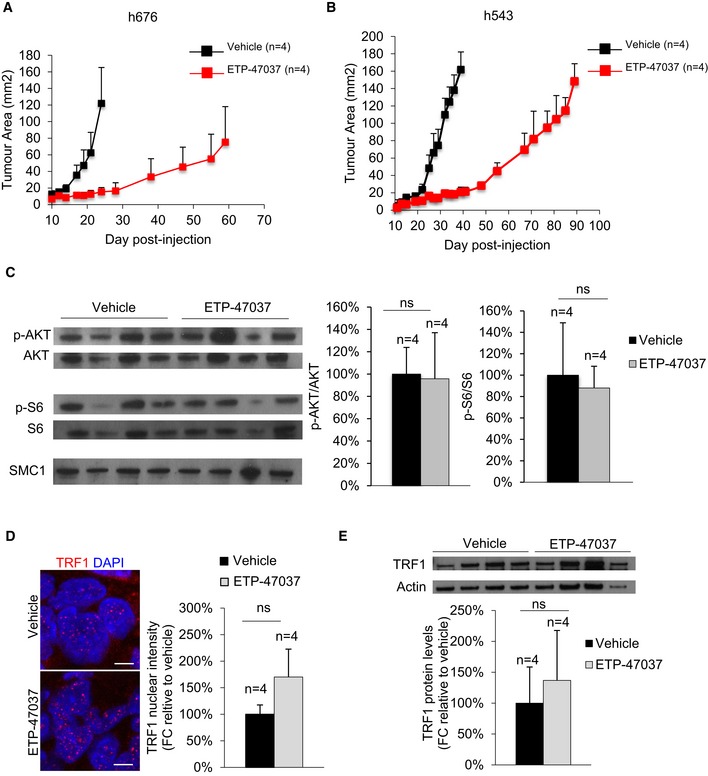
Figure EV3. Patient‐derived xenografts become resistant to PI3Ki.

-
ALongitudinal tumor growth follow‐up in ETP‐47037 or vehicle‐treated mice injected with patient‐derived h676 GSCs. Data are representative of n = 4 independent tumors.
-
BLongitudinal tumor growth follow‐up in ETP‐47037 or vehicle‐treated mice injected with patient derived h543 GSCs. Data are representative of n = 4 independent tumors.
-
CWestern blot images (left) and p‐AKT/AKT or pS6/S6 protein levels (right) in vehicle‐ or ETP‐47037‐treated tumors. Data are representative of n = 4 independent tumors.
-
DTRF1 nuclear fluorescence in ETP‐47037 or vehicle‐treated tumors. Scale bars, 10 μm. Data are representative of n = 4 independent tumors
-
EWestern blot images (left) and TRF1 protein levels (right) in vehicle‐ or ETP‐47037‐treated tumors. Data are representative of n = 4 independent tumors.
