-
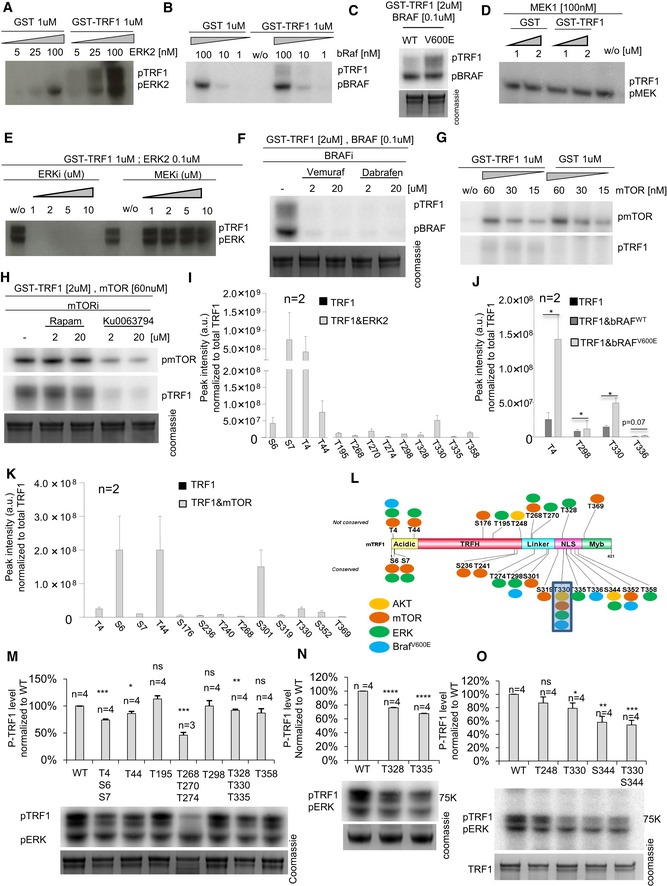
A–D
1 or 2 μM of GST or GST‐TRF1 was incubated with the indicated concentrations of mouse ERK2 kinase (A), human BRaf kinase (WT or V600E) (B, C), or mouse MEK1 kinase (D) in the presence of 5 μCi [γ‐32P]ATP. The mixture was resolved by SDS–PAGE followed by autoradiography.
-
E
1 μM of GST‐TRF1 and 0.2 μM of mouse ERK2 kinase were incubated in the presence of ERK and MEK inhibitors.
-
F
2 μM of GST‐TRF1 and 0.1 μM of human BRaf kinase were incubated in the presence of the bRaf inhibitors dabrafenib and vemurafenib.
-
G, H
1 or 2 μM of GST or GST‐TRF1 was incubated with the indicated concentrations of human mTOR kinase (G) in the presence of the mTOR inhibitors rapamycin and Ku0063794 (H).
-
I–K
Phosphopeptide peak intensity normalized to total TRF1 signal in samples containing only TRF1 or TRF1 plus ERK2 (I), TRF1 plus bRAFWT or bRAFV600E (J), and TRF1 plus mTOR (K); data are representative of n = 2 independent experiments.
-
L
Schematic representation of TRF1 protein with the phosphorylation sites by ERK2, bRAF, mTOR, and AKT.
-
M–O
Representative image (down) and quantification (up) of in vitro phosphorylation assays with the indicated GST‐TRF1 wild‐type or mutated forms in the presence of mouse ERK2 kinase. Data are representative of n = 4 independent experiments.
Data information: Data are represented as mean ± SEM. Significant differences using unpaired
< 0.0001.

