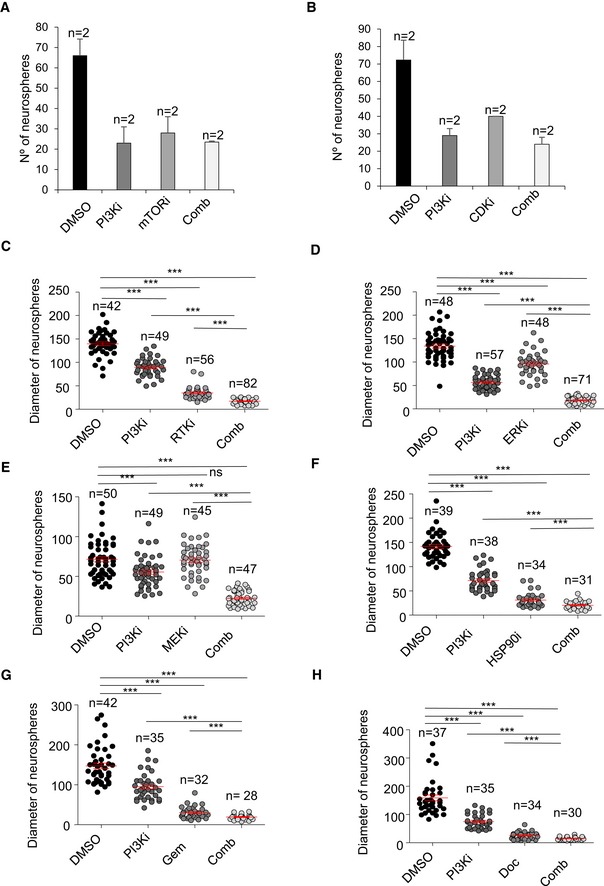
C–HDiameter of spheres formed by patient‐derived h676 GSCs 7 days after treatment with the indicated compounds as single agents or in combination. n represents biological replicates: in (C) DMSO n = 42, PI3Ki n = 49, RTKi n = 56, Comb n = 82; in (D) DMSO n = 48, PI3Ki n = 57; ERKi n = 48, Comb n = 71; in (E) DMSO n = 50; PI3Ki n = 49, MEKi n = 45, Comb n = 47; in (F) DMSO n = 39, PI3Ki n = 38, HSP90i n = 34, Comb n = 31; in (G) DMSO n = 42, PI3Ki n = 35, Gem n = 32, Comb n = 28; in (H) DMSO n = 37, PI3Ki n = 35, Doc n = 34, Comb n = 30.

