-
A
Trf1
lox/lox
p53
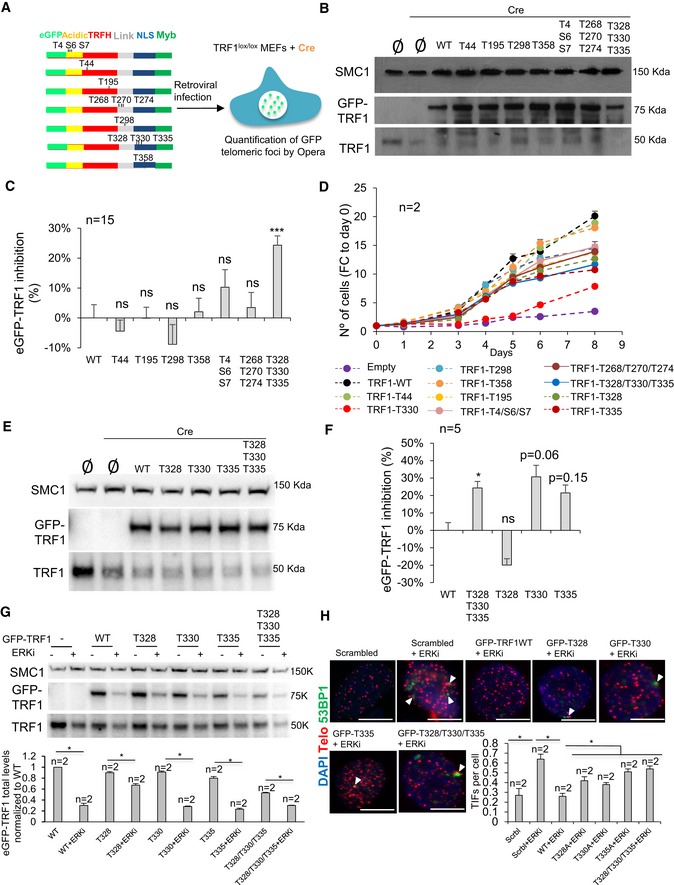
−/− MEFs were transduced with eGFP‐tagged Trf1 WT or mutant alleles to overexpressed TRF1 depicted variants. Endogenous TRF1 was deleted by transduction with Cre recombinase. Opera High Content Screening (HCS) system was used to quantify the GFP spot intensity per cell.
-
B
Western blot images of Trf1
lox/lox MEFs with or without overexpression of eGFP‐Trf1 WT or mutant alleles followed by Cre recombinase transduction.
-
C
Quantification of eGFP‐TRF1 inhibition in Trf1
Δ/Δ MEFs transduced with eGFP‐Trf1 WT or mutant alleles as indicated. Data are representative of n = 15 biological replicates
-
D
Growth curves of Trf1
Δ/Δ MEFs transduced with eGFP‐Trf1 WT or mutant alleles as indicated. Data are representative of n = 5 biological replicates
-
E
Western blot images of Trf1
lox/lox MEFs with or without overexpression of eGFP‐Trf1 WT or mutant alleles followed by Cre recombinase transduction.
-
F
Quantification of eGFP‐TRF1 inhibition in Trf1
Δ/Δ MEFs transduced with eGFP‐Trf1 WT or mutant alleles as indicated. Data are representative of n = 5 biological replicates
-
G
Western blot images of p53
−/− MEFs with or without overexpression of eGFP‐Trf1 WT or mutant alleles followed treatment with ERKi. Data are representative of n = 2 biological replicates
-
H
Representative images (above) and percentage (bottom) of telomeric and 53BP1 colocalizing foci (TIFs) per cells of p53
−/− MEFs with or without overexpression of eGFP‐Trf1 WT and the indicated mutants upon treatment with the ERKi. White arrowheads: colocalization of telomeric and 53BP1. Scale bars, 10 μm. Data are representative of n = 2 independent experiments.
Data information: Data are represented as mean ± SEM. Significant differences using unpaired
< 0.001.

