
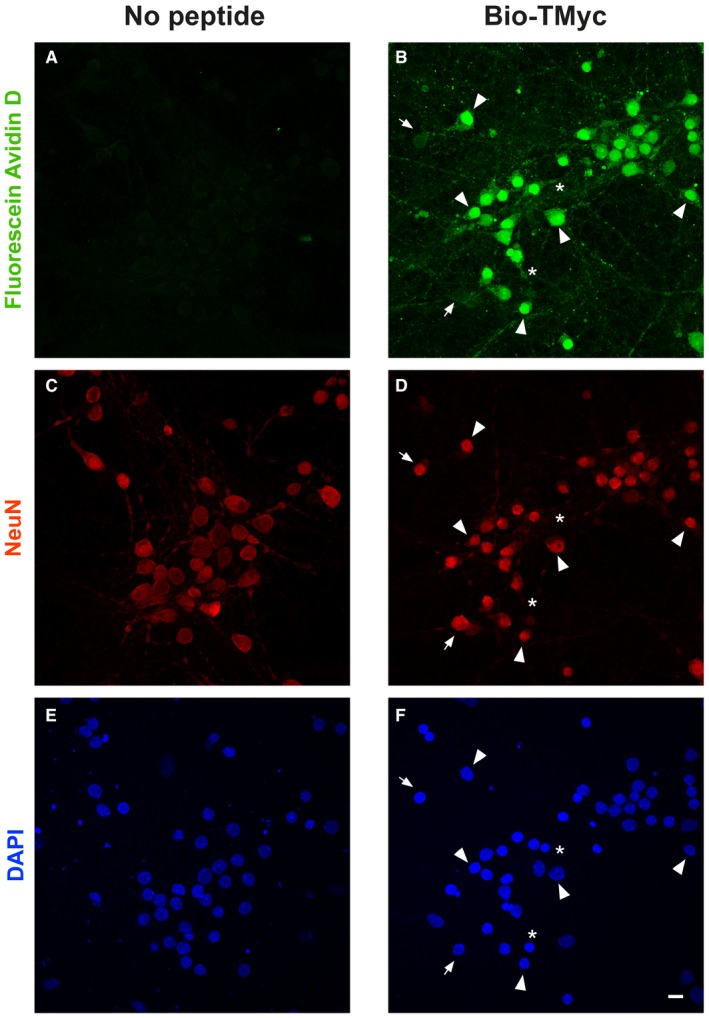
Figure EV2. Quantitation of peptide entry into neurons.
-
A–FCultures were treated with no peptide or Bio‐TMyc (25 μM, 1 h), detected by Fluorescein Avidin D (green), and stained with anti‐NeuN (red) and DAPI (blue). Representative confocal images corresponding to maximum intensity projections were used to quantitate peptide entry into neurons (arrowheads; n = 5). A minority of neurons did not incorporate detectable peptide amounts (arrows). Scale bar, 10 μm.