
Figure EV4. Detailed analysis of Bio‐NA‐1 delivery to mice cortex.
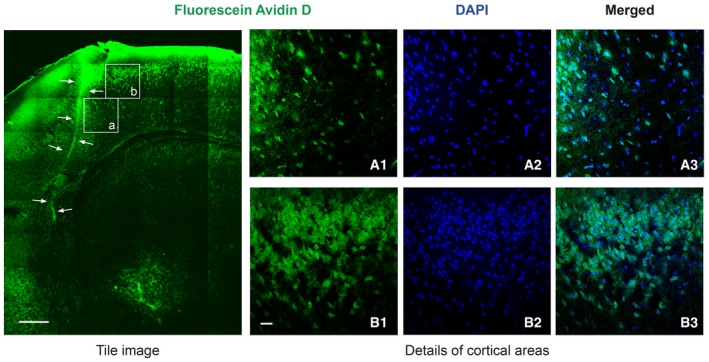
Biotinylated NA‐1 (Bio‐NA‐1, 4 nmol/g, i.v.) was detected in coronal sections stained with DAPI. Representative confocal microscopy images correspond to single sections. A tile image of cortical and sub‐cortical areas is shown, arrows denoting a heavily fluorescent vessel. Details of two cortical regions in the proximity (a.1–a.3) or further (b.1–b.3) of this vessel are also presented. Scale bar, 250 μm (tile image); 100 μm (details).