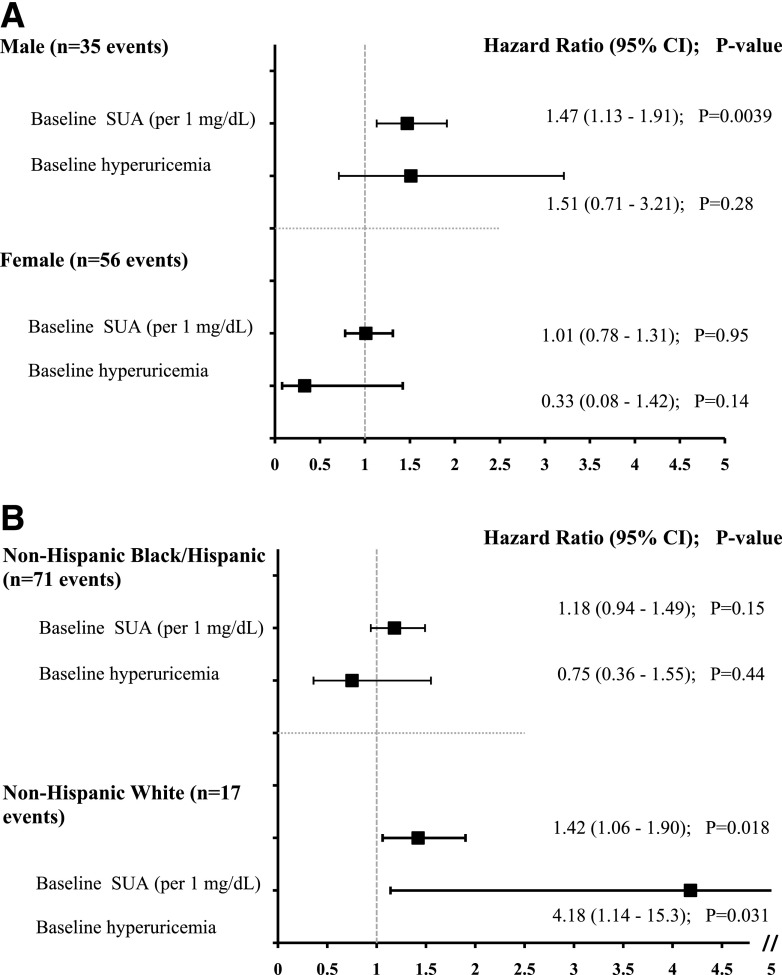
Figure 2.
Forest plot portraying the HR, 95% CI, and P value of the association between baseline SUA or hyperuricemia and incident elevated UAE (UACR ≥30 mg/g) stratified by sex (A) and race/ethnicity (B) in adjusted models over time in TODAY. All models were adjusted for baseline eGFR, age, HbA1c, BMI, antihypertensive medication use, sex (for model B), and race/ethnicity (for model A).

