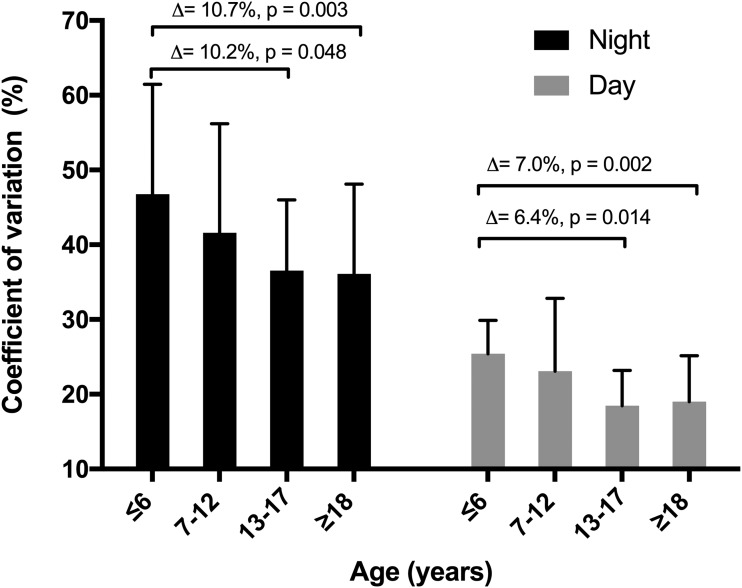
Figure 1.
The coefficient of variation for insulin requirements during hybrid closed-loop insulin delivery. Each bar represents an age-group (young children, children, adolescents, and adults); black bars denote nighttime (0000–0559 h) and gray bars daytime (0600–2359 h) periods. Data are mean ± SD.

