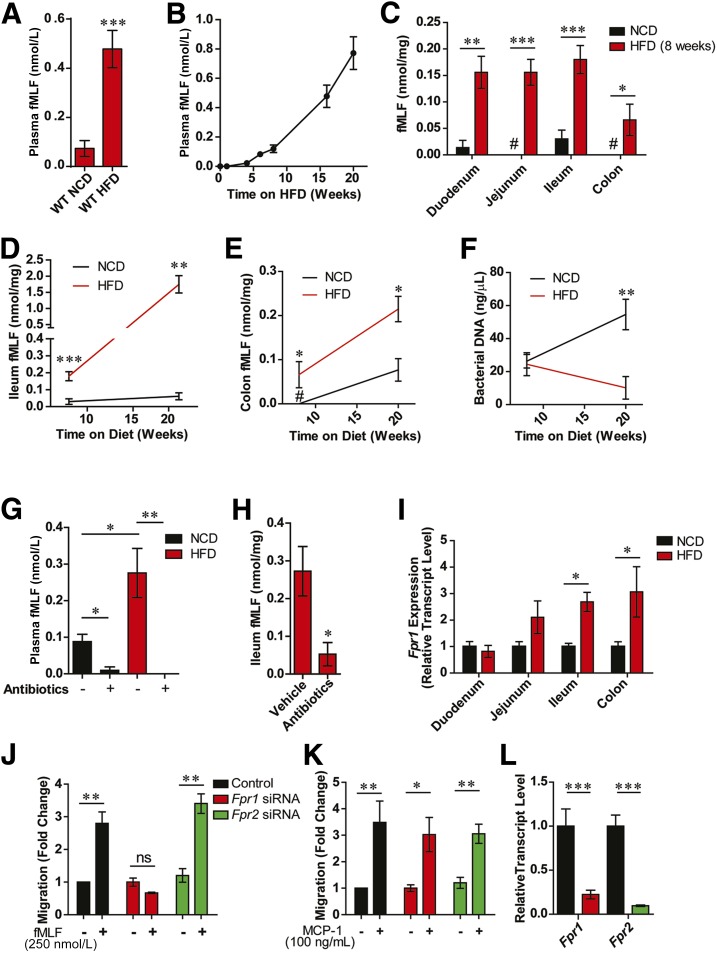
Figure 1.
fMLF is increased in HFD/obese mice and requires Fpr1 for chemotaxis. A: Blood plasma fMLF levels in lean/NCD vs. obese/HFD mice after 16 weeks on an HFD (n = 8–12 mice/group). B: Timecourse of fMLF levels after placement on an HFD (n = 6–8 mice per time point). C: fMLF levels in various intestinal tissues in WT NCD and HFD animals after 8 weeks on diet (n = 8 mice/group). Ileum (D) and colon (E) fMLF levels after 8 and 20 weeks of HFD or NCD (n = 6–8 mice/group). F: Bacterial DNA levels in colon fecal samples, determined by 16S rRNA gene expression and presented as a measure of bacterial load (n = 8 mice/group). G: Blood plasma fMLF levels in NCD and HFD mice (after 8 weeks on diet) treated with or without antibiotics (n = 6–8 mice/group). H: Ileum fMLF levels in HFD antibiotic-treated animals, after 8 weeks on diet (n = 4 mice/group). I: Relative Fpr1 transcript levels in various intestinal tissues of NCD and HFD WT animals after 8 weeks on diet (n = 8 mice/group). J: Chemotaxis assays of thioglycollate-elicited intraperitoneal macrophages (IP-Macs) in response to fMLF treatment (250 nmol/L), and after siRNA knockdown of Fpr1 or Fpr2 (n = 3). K: Chemotaxis assays in response to MCP-1 treatment (100 ng/mL) demonstrate that knockdown of Fpr1 does not inhibit macrophage activation by other chemokines. L: mRNA transcript levels of Fpr1 and Fpr2 in IP-Macs after siRNA knockdown. #Below detection limit. Data are mean ± SEM. ns, not significant. *P < 0.05, **P < 0.001, ***P < 0.0001 by one-way ANOVA with Bonferroni post-test (D–G) or two-tailed t test comparing the indicated groups. In D–F, statistical significance is indicated by comparing groups at each respective time point.

