Figure 1.
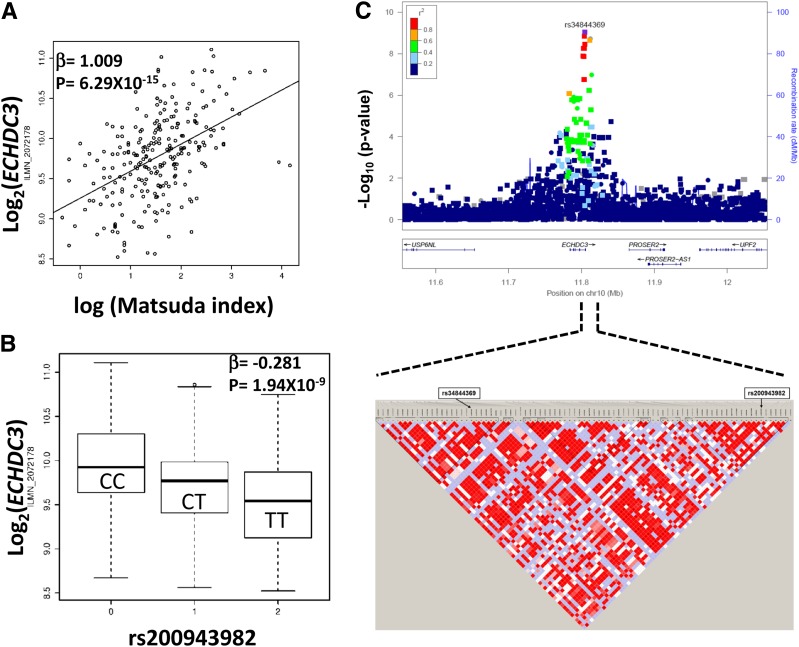
ECHDC3 transcript expression in adipose tissue is correlated with Matsuda index of insulin sensitivity and is genetically regulated in African Americans. The scatter plot shows correlation of ECHDC3 transcript expression (ILMN_2072178) in adipose tissue with Matsuda index in AAGMEx (A). The box plot shows association of ECHDC3 transcript expression (ILMN_2072178) in adipose tissue with genotype of the cis-eSNP rs200943982 (B). LocusZoom plots show regional association of ECHDC3 cis-eQTL region SNPs (genotyped and imputed) with transcript expression (C). Significance level (−log10 P values) of genotyped SNPs are indicated as circles and imputed SNPs are indicated as squares in the LocusZoom plot. Linkage disequilibrium plot below the LocusZoom plot shows linkage disequilibrium relationship (r2) between SNPs in the marked region and indicates the location of top imputed and genotyped cis-eSNP for ECHDC3, rs34844369 and rs200943982, respectively.

