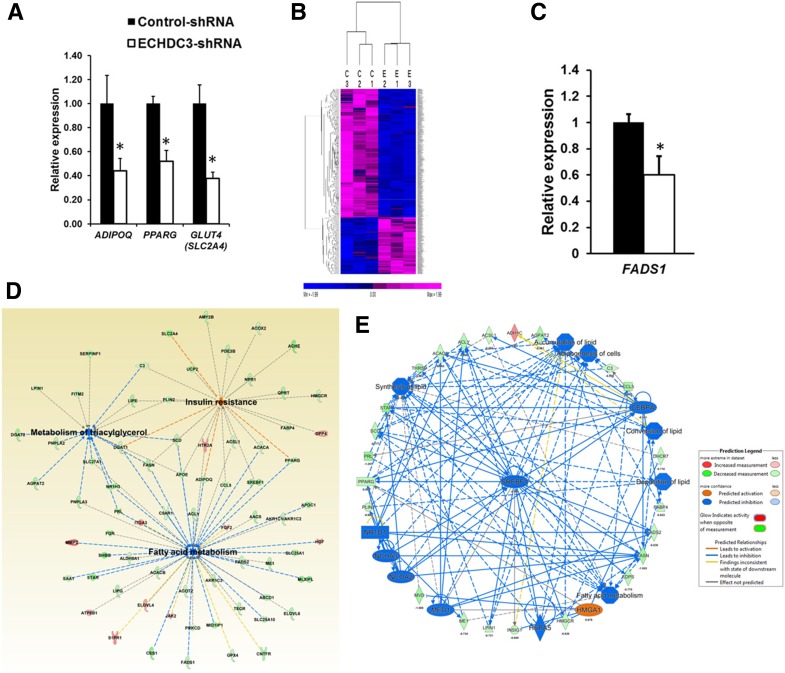
Figure 4.
Knocking down ECHDC3 gene in adipocytes modulates many pathways including genes in insulin sensitivity. A: Bar graph showing results from the qRT-PCR analysis of expression of adiponectin (ADIPOQ), peroxisome proliferator–activated receptor γ (PPARG), and facilitated glucose transporter-4 (GLUT4/SLC2A4) mRNA (normalized to RPLP0) in SGBS cells stably expressing control shRNA or ECHDC3 shRNA at 14 days post–initiation of differentiation. Bar graph indicates the mean ± SD of six biological replicates for each condition from two independent experiments. *P < 0.01. B: Heat map from unsupervised hierarchical clustering showing expression of 691 DEGs in ECHDC3-KD (E) compared with control shRNA–treated (C) SGBS cells at day 14 of differentiation. The expression levels of genes from RNA-seq analysis (FPKM values) were z score transformed for clustering analysis. The intensity of purple and blue color in heat map indicates the degree of high and low expression of transcripts, respectively. C: qRT-PCR analysis validates downregulation of fatty acid desaturase 1 (FADS1) in ECHDC3-KD SGBS cells in six biological replicates for each condition from two independent experiments. D: A network diagram from IPA that includes selected DEGs in ECHDC3-KD cells, significantly enriched for genes involved in the metabolism of triacylglycerol, fatty acid metabolism, and IR. E: Top regulatory network (consistency score = 20.85 and 37 nodes) identified by regulator effects analysis in IPA connected 23 DEGs with eight putative network regulators in ECHDC3-KD cells and suggested its impact on multiple biological processes in adipocytes including accumulation of lipid and adipogenesis.

