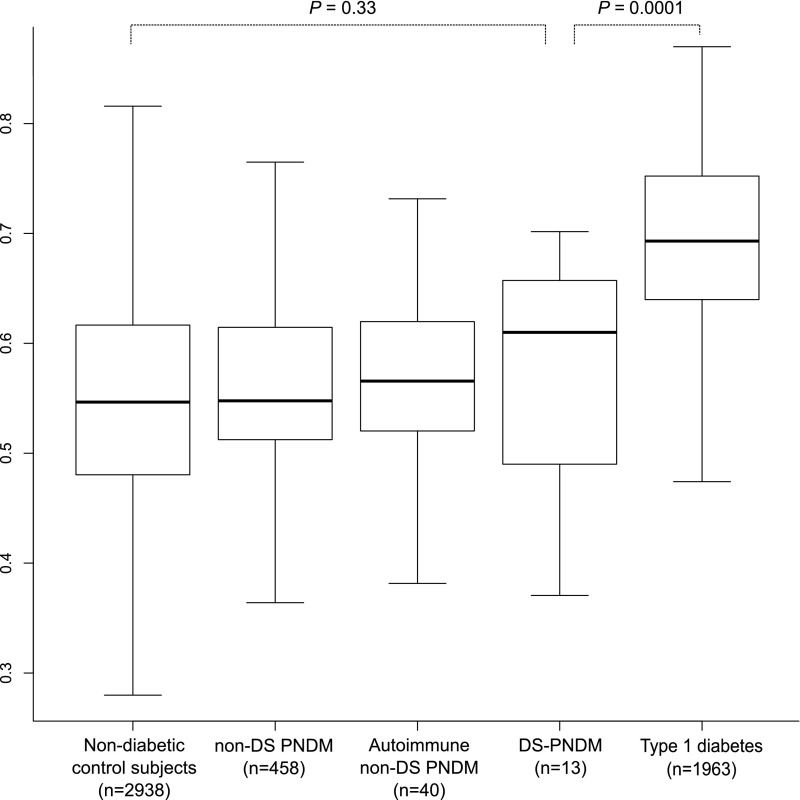
Figure 3.
The T1D-GRS in DS-PNDM. Patients with DS-PNDM (n = 13) had a lower score than T1D control subjects (n = 1,963), and their scores were similar to those with the known monogenic forms of non-DS PNDM and autoimmune non-DS PNDM (n = 458 and n = 40, respectively; P = 0.52) and control subjects without diabetes (n = 2,938; P = 0.33). The central line within the box represents the median, and the upper and lower limits of the box represent the interquartile range. The whiskers are the most extreme values within 1.5× the interquartile range from the first and second quartiles.

