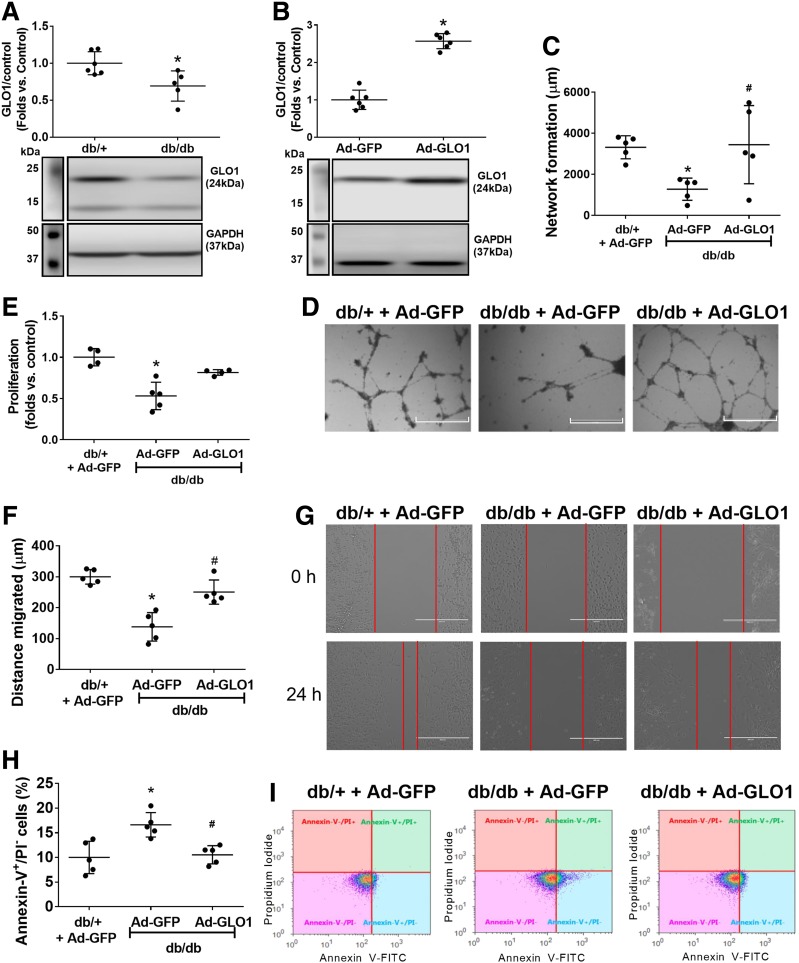
Figure 3.
GLO1 overexpression rescued diabetes-induced BMPC dysfunction. A: Western blot analysis showing deficient expression levels of GLO1 in diabetic BMPCs compared with healthy controls (n = 5 per group). *P < 0.01 vs. db/+. B: Western blot analysis of GLO1 protein level in db/db BMPCs infected with Ad-GLO1, using db/db BMPC-infected Ad-GFP as diabetic control (n = 5 per group). *P < 0.05 vs. db/db plus Ad-GFP. C: Dot plot of network formation quantification of db/db BMPCs infected with Ad-GLO1 or Ad-GFP or db/+ BMPCs infected with Ad-GFP (n = 5 per group). *P < 0.05 vs. db/+ plus Ad-GFP; #P < 0.05 vs. db/db plus Ad-GFP. D: Representative images of network formation. Scale bar = 1,000 μm. E: Dot plot of proliferation assay of db/db BMPCs infected with Ad-GLO1 or Ad-GFP or db/+ BMPCs infected with Ad-GFP (n = 5 per group). *P < 0.05 vs. db/+ plus Ad-GFP. F: Dot plot of migration assay of db/db BMPCs infected with Ad-GLO1 or Ad-GFP or db/+ BMPCs infected with Ad-GFP (n = 5 per group). *P < 0.05 vs. db/+ plus Ad-GFP; #P < 0.05 vs. db/db plus Ad-GFP. G: Representative images of migration. Scale bar = 1,000 μm. H: Dot plot of the percent apoptotic cells in db/db BMPCs infected with Ad-GLO1 or Ad-GFP or db/+ BMPCs infected with Ad-GFP (n = 5 per group). *P < 0.05 vs. db/+ plus Ad-GFP; #P < 0.05 vs. db/db plus Ad-GFP. I: Representative scatter plots showing the distribution of Annexin-V+/PI− cells.

