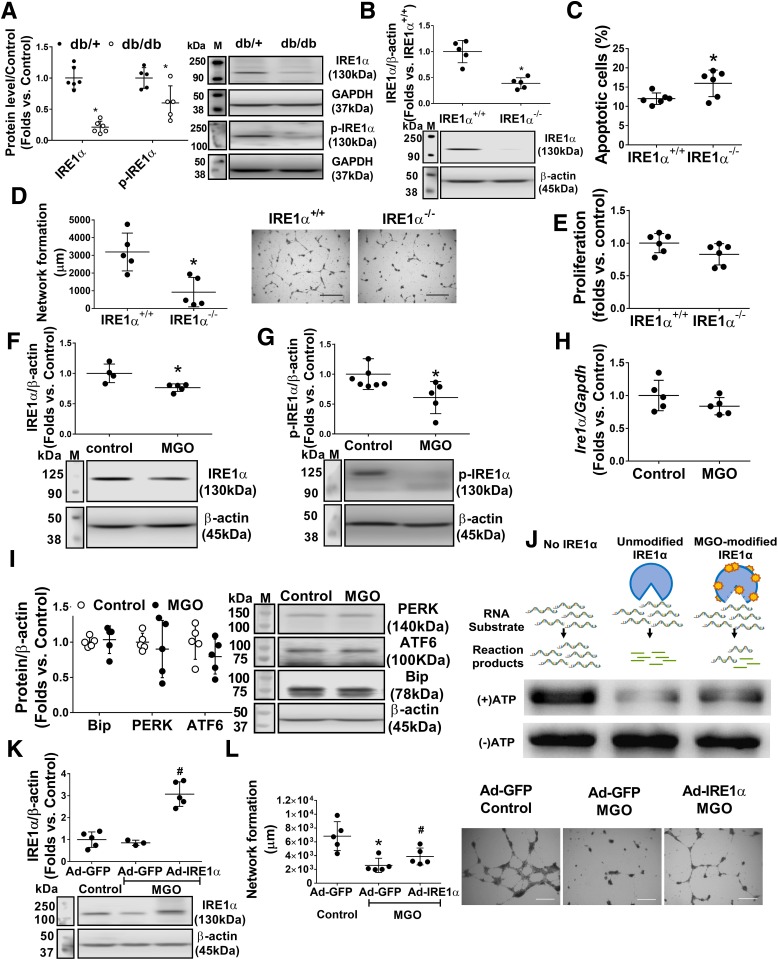
Figure 4.
IRE1α deficiency contributes to BMPC dysfunction, and MGO suppresses IRE1α expression at the protein level. Overexpression of IRE1α rescues BMPC dysfunction after MGO exposure. A: Western blot analysis of expression levels of IRE1α and the phosphorylated form of IRE1α (p-IRE1α) in db/db and db/+ BMPCs. Representative protein bands are shown (n = 5 per group). *P < 0.05 vs. db/+. B: Western blot analysis of IRE1⍺ level in IRE1α+/+ BMPCs infected with Ad-Cre (IRE1α−/−) or Ad-GFP (IRE1α+/+) (n = 5 per group). *P < 0.05 vs. IRE1α+/+. C: Apoptosis of IRE1Α−/− or IRE1α+/+ BMPCs was evaluated by caspase 3/7 assay (n = 5 per group). *P < 0.05 vs. IRE1α+/+. D: Network formation quantification of IRE1α−/− or IRE1α+/+ BMPCs (n = 5 per group). *P < 0.05 vs. IRE1α+/+. Representative pictures are shown. Scale bar = 1,000 μm. E: Proliferation of IRE1α−/− or IRE1α+/+ BMPCs (n = 5 per group). F: Western blot analysis of IRE1⍺ in db/+ BMPCs exposed to 10 μmol/L MGO for 24 h (n = 5 per group). *P < 0.05 vs. control. G: Western blot analysis of p-IRE1 in db/+ BMPCs exposed to 10 μmol/L MGO for 24 h (n = 5 per group). *P < 0.05 vs. control. H: Levels of Ire1 mRNA in db/+ BMPCs exposed to MGO (n = 5 per group). I: Western blot analysis of protein levels of PERK, ATF6, and Bip in db/+ BMPCs exposed to MGO (n = 5 per group). J: Agarose electrophoresis of IRE1α-mediated RNA cleavage assay of native and MGO-modified IRE1α. One microgram of in vitro–transcribed RNA (pre-miR-466:pre-miR-200 = 1:1) was used as RNA substrate of IRE1α. The cleavage reaction without ATP initiation was used as loading control. Left lane: RNA substrate without IRE1α incubation. Middle lane: spliced RNA substrate after native IRE1α incubation. Right lane: RNA substrate incubated with MGO-modified IRE1α. K: Western blot analysis of IRE1α protein expression in db/db BMPCs infected with Ad-IRE1α or Ad-GFP after exposure of 10 μmol/L MGO for 24 h (using H2O as control) (n = 5 per group). #P < 0.05 vs. db/db plus Ad-IRE1α plus MGO. L: Network formation quantification of db/db BMPCs infected with Ad-IRE1α or Ad-GFP after MGO exposure (n = 5 per group). *P < 0.05 vs. db/db plus Ad-GFP plus control; #P < 0.05 vs. db/db plus Ad-GFP plus MGO. Representative images of tube network are shown. M, protein marker. Scale bar = 1,000 μm.

