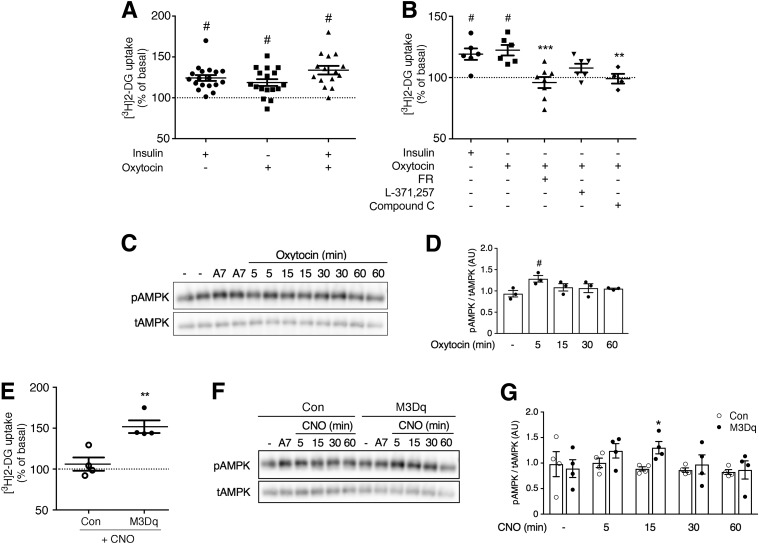
Figure 6.
Glucose uptake and Western blotting studies with primary HSMMs. A: HSMMs were treated with insulin (100 nmol/L), OT (1 μmol/L), or a mixture of insulin (100 nmol/L) and OT (1 μmol/L) (for details, see research design and methods). Drug-induced increases in [3H]2-DG uptake were determined as described in research design and methods. B: OT (1 μmol/L)-induced [3H]2-DG uptake is abolished or greatly reduced by several pharmacological inhibitors. The following inhibitors were used: FR900359 (FR; 1 μmol/L), selective Gq/11 inhibitor; L371,257 (1 μmol/L), selective OT receptor antagonist; and compound C (10 μmol/L), AMPK blocker. C: Representative Western blot demonstrating that OT (1 μmol/L) treatment of HSMMs promotes AMPK phosphorylation (at 5 min). A769662 (A7; 30-min incubation; 10 μmol/L), a potent activator of AMPK, served as a positive control. D: Densitometric quantification of immunoblotting data shown in C (means ± SEM; three independent experiments; #P < 0.05 as compared with no drug). E: Activation of the Gq-linked M3Dq designer receptor promotes glucose uptake in human SKM cells. HSMMs were transduced with adenoviruses encoding either GFP (control [Con]) or M3Dq, as described in research design and methods. Transduced HSMMs were then treated with CNO (10 μmol/L), followed by [3H]2-DG uptake measurements. F: Representative Western blot demonstrating that CNO (10 μmol/L) treatment of HSMMs expressing the M3Dq construct promotes AMPK phosphorylation. Western blotting studies were carried out with HSMMs expressing either M3Dq or GFP (control). CNO selectively promotes AMPK phosphorylation in M3Dq-expressing cells (at 15 min). G: Densitometric quantification of immunoblotting data shown in F (means ± SEM; four independent experiments; *P < 0.05 as compared with control). Glucose uptake data are given as means ± SEM of 15–18 (A) or 4–8 (B and E) independent experiments performed in duplicate. All responses were expressed relative to baseline responses (set equal to 100%) obtained in the absence of drugs. Basal [3H]2-DG uptake values were not significantly different (P = 0.60) between M3Dq-expressing and GFP control cells (4,630 ± 1,605 and 3,442 ± 1,416 dpm/mg protein, respectively). #P < 0.05 as compared with baseline (100%; no drug treatment; one-sample t test) (A and B); **P < 0.01, ***P < 0.001 vs. OT alone (one-way ANOVA with Dunnett multiple-comparisons test) (B); **P < 0.01 vs. control (t test) (E). AU, arbitrary units; tAMPK, total AMPK.

