Figure 4.
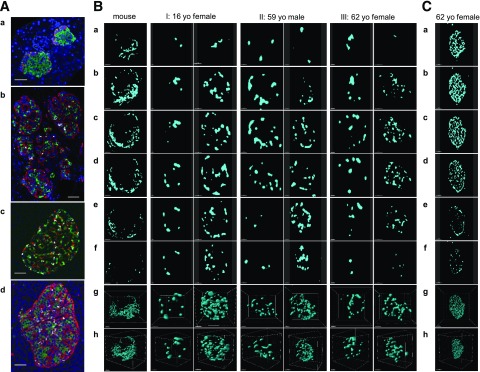
No subunit formation of the mantle-core arrangement in the human islet. A: 2D images of islets immunostained for insulin (green), glucagon (red), and somatostatin (white). (a) Mouse islets. Scale bar: 50 μm. (b) Human islets of various sizes. Scale bar: 50 μm. (c) Large islet. Scale bar: 50 μm. (d) Large islets. Scale bar: 100 μm. B: α-Cell distribution in mouse islets (8-week-old C57BL/6J) and human islets from three different donors (I: 16-year-old [yo] girl, II: 59-year-old man, III: 62-year-old woman). (a–f) Serial optical z-slices from top to bottom of the islet. Fluorescent signal for glucagon after binary conversion is shown. Front view (g) and side view (h) of 3D-rendered α-cells. Scale bar: 50 μm for mouse in a–f, 30 μm for mouse in g and h, all 30 μm for I except 20 μm for g, and all 20 μm for II and III. Scale bars: 30 μm for I except 50 μm for g and h, all 50 μm for II, and 20 μm for III except 40 μm for g and h. C: Serial z-slices of a large islet depicting glucagon signal from top to bottom and 3D rendering. (a–f) Top to bottom serial z-slices of islet showing binary converted fluorescence. (g) Front view of 3D-rendered α-cells. (h) Side view of g. Scale bar: 80 μm for a–f, 70 μm for g, and 100 μm for h. See also Supplementary Figs. 1–4 and Supplementary Movies 1–7.

